NQT survey 2008
NQT survey 2008. NQT Survey 2008 – response rate. Questionnaire mailed to 32,000 NQTs 14,000 responded over a 15 week period Response rate 44 per cent (compared with 36 per cent in 2007). NQT Survey 2008 – pattern of returns. NQT Survey 2008 – publication of results.

NQT survey 2008
E N D
Presentation Transcript
NQT Survey 2008 – response rate • Questionnaire mailed to 32,000 NQTs • 14,000 responded over a 15 week period • Response rate 44 per cent (compared with 36 per cent in 2007)
NQT Survey 2008 – publication of results • Sector level analysis published in July on TDA website: • http://www.tda.gov.uk/partners/datasurveys/nqtsurvey/nqtsurveyarchive.aspx • Provider level analyses were published w/c 15 September 2008 • http://dataprovision.tda.gov.uk/public/page.htm?to-page=providersNqtSurvey • Data are available on providers’ website • https://dataprovision.tda.gov.uk/provider/page.htm?to-page=analysisProviderLogin
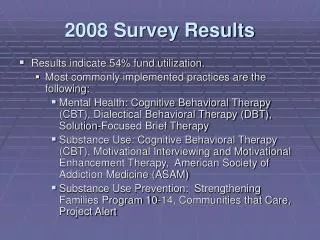
NQT Survey 2008 – summary key sector level findings • Significant differences between primary and secondary ITT • In primary • The ratings given by the 2008 NQTs for most of the questions were lower than in the 2007 survey • Key areas where the NQTs’ ratings were lower, and contributed to a continued downward trend, were understanding: • the National Curriculum • the primary national strategy • Key areas of improvement were: • Preparation to teach reading including phonics and comprehensive • Understanding the foundation stage • Understanding Every Child Matters
NQT Survey 2008 – summary key sector level findings • In secondary • For 15 out 25 questions ratings reached their highest levels in the 2007 survey, and 2008 responses equalled or represented an improvement on these. • Biggest improvements were recorded in the following areas: • the use of ICT in teaching • teaching ME learners • teaching learners with EAL • use of the CEDP • sharing responsibility for CPD • understanding ECM • Key areas where NQTs’ ratings were lower were: • planning teaching • monitoring and reporting learners’ progress • working with teaching colleagues
NQT Survey 2008 – trends in primary – assessment and feedback – support and guidance
NQT Survey 2008 – trends in primary – National Curriculum – specialist subject
NQT Survey 2008 – trends in primary – classroom behaviour – range of teaching methods
NQT Survey 2008 – trends in primary – ME learners – learners with EAL
NQT Survey 2008 – trends in primary – learners with SEN – learners of different abilities
NQT Survey 2008 – trends in primary – working with teaching colleagues – managing the work of others
NQT Survey 2008 – trends in primary – parents and carers – welfare and safeguarding
NQT Survey 2008 – trends in primary – induction – CEDP - CPD
NQT Survey 2008 – trends in primary – foundation stage – primary national strategy
NQT Survey 2008 – trends in primary – literacy and mathematics elements of the primary national strategy
NQT Survey 2008 – trends in secondary – assessment and feedback – support and guidance
NQT Survey 2008 – trends in secondary – National Curriculum – specialist subject
NQT Survey 2008 – trends in secondary – classroom behaviour – teaching methods
NQT Survey 2008 – trends in secondary – planning - monitoring
NQT Survey 2008 – trends in secondary – ME learners – learners with EAL
NQT Survey 2008 – trends in secondary - learners with SEN – learners of different abilities
NQT Survey 2008 – trends in secondary - working with teaching colleagues – managing the work of others
NQT Survey 2008 – trends in secondary – parents and carers – welfare and safeguarding
NQT Survey 2008 – trends in secondary – induction – CEDP - CPD
NQT Survey 2008 – trends in secondary – secondary national strategy
NQT Survey 2008 – trends in secondary – English, ICT, science and mathematics elements of the secondary national strategy
NQT Survey 2008 • Any questions • Contact us • Martin Furner martin.furner@tda.gov.uk • Barbara Riley barbara.riley@tda.gov.uk