Download
1 / 14
140 likes | 265 Vues
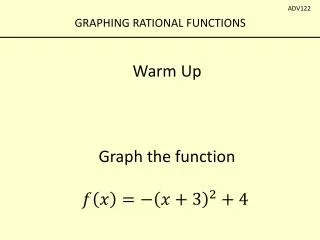
In this lesson, you will learn how to graph linear inequalities in two variables effectively. We'll review key concepts, including the steps to rewrite inequalities in slope-intercept form, graphing the equations, and shading the appropriate areas based on the inequality symbols. You’ll also analyze provided examples to check solutions at specific points, like (0,0) or (2,-1), and practice with partner work and homework assignments. By the end, you’ll confidently handle various linear inequalities and explain your reasoning behind the graphs.

E N D
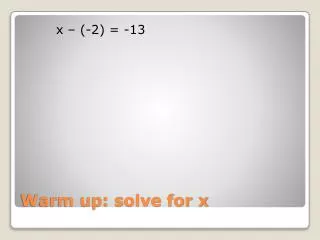
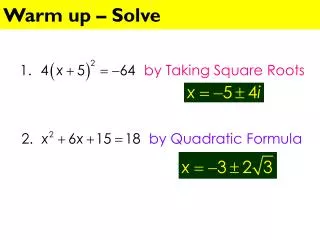
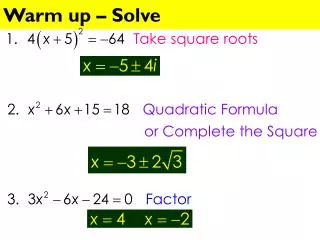
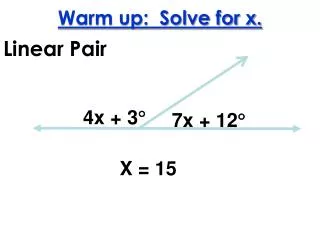
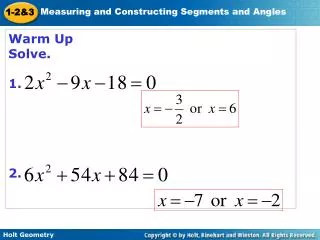
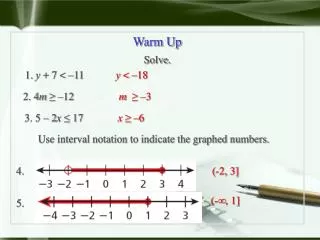
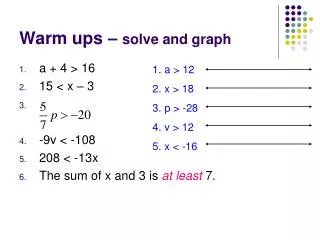
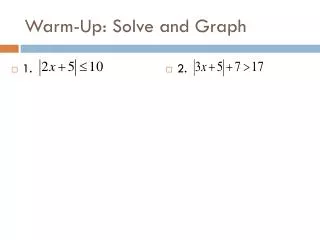
Warm-Up: Solve and Graph • 1. • 2.
Miss ZeugginNovember 5th 2008Objectives: graph a linear inequality in two variables Standards: 2.5, 2.8
Chapter 6 Section 5 Graphing Linear In equalities in Two Variables
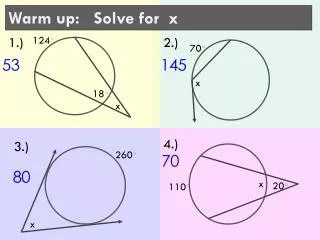
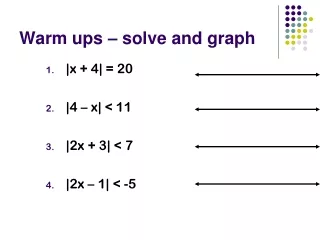
Inequality Review • Graph the following Inequalities Examples:
Checking Solutions of a Linear Inequality • Is (0,0) a solution of ? • Is (2,-1) a solution of
Graphing Inequalities • STEPS: • Rewrite equation in slope-intercept form y=mx+b • Graph the equation • Choose a point to check • Shade in the correct area • < or > is a dotted line • ≤ or ≥ is a solid line
Examples • 1. Graph the inequality • Step 1: • Graph • Check: Point (-3,0) • Shade:
Examples: • 2. • 3.
Examples: • 4. • 5.
Examples: • 6. • 7.
Examples: • 8. • 4.
Partner Class Work • Kyle and Shay- Page 363 #23, 10 • Tyler and Alyssa- Page 363 #24, 8 • Kevin and Albert- Page 363 #11, 25 • Martin and Mrs. K- Page 363 #12, 26 • Graph the Inequalities and explain your reasoning on how you solved it
Closure • Graph the following • 1. • How Many Answers Should You have for #1? • 2. • How Many Answers Should You have for #2?
Homework • Page 363 #52-60 • Page 384 #1-10, 12, 13