Download
1 / 27
280 likes | 540 Vues
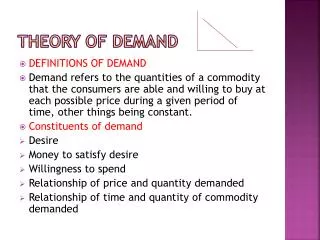
Part 4 The Theory of Demand. We have drawn all our demand curves downward sloping Why do economists think demand curves normally slope downward? Market demand curves are aggregations of individual (or household) demand curves What factors will affect a household’s demand for a good?.

E N D
Part 4The Theory of Demand • We have drawn all our demand curves downward sloping • Why do economists think demand curves normally slope downward? • Market demand curves are aggregations of individual (or household) demand curves • What factors will affect a household’s demand for a good?
Household Consumption Choices • Households buy a variety of goods (a “bundle” of goods) • Different households buy different bundles of goods • Household choice will depend on: - income - relative prices of goods - preferences • Income and prices can be shown in a budget constraint • What shapes preferences? • How can a given set of preferences be represented?
Budget Constraint Qy Unaffordable Affordable Qx Budget constraint with given income = I and given prices Px and Py: I = PxQx + PyQy
Preferences and Utility • Which of the affordable combinations will a household choose to purchase? • The intuitive answer is that the household will choose the bundle of goods that it “likes the best” or provides the most satisfaction of all the affordable bundles • More formally, if the degree of satisfaction of all wants and desires can be measured on a single “utility” scale, the household will choose the bundle of goods that maximizes utility
Cardinal Utility Theory • When the idea of a utility measure was first proposed in economics it was sometimes assumed that one could think of units of utility in the same way as units of weight or temperature • Such a measure has a defined unit that can be added, multiplied, & etc • Many possible units of measure but they are all linear transformations of each other (eg: deg F = 32 + 9/5 C)
Total and Marginal Utility • More goods give more total utility • More of any particular good will tend to give less additional total utility with each increment • Diminishing marginal utility • Diminishing marginal utility and the “paradox of value” • What is the rule for maximizing total utility out of a given budget when each good has diminishing marginal utility?
Maximizing Utility Example of two goods x and y Utility maximizing bundle with an income Of $6 and Px and Py= $1? Utility maximizing bundle with an income $16 and Px=$3 and Py=$2
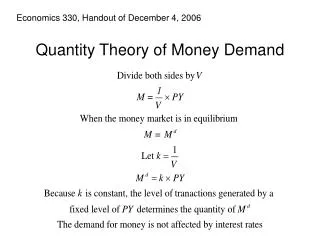
Maximizing Utility • The total utility gained from a given budget will be maximized where the budget is all spent and marginal utility per dollar spent is equalized across all goods • Rules for a utility maximum: I=PxQx+PyQy and MUx/Px = MUy/Py or MUx/MUy = Px/Py
Implications • Maximization is where I=PxQx+PyQy and MUx/Px = MUy/Py • Fall in Px will increase ability to purchase X and Y. If X is normal Qx increases. • Fall in Px leads to a substitution of X for Y • Increase in Qx decreases MUx • Decrease in Qy increases MUy
Individual and Market Demand • Market demand curves are the horizontal summation of the demand curves of all individuals or households
Ordinal Utility Theory • The idea of utility as measurable in a cardinal way was subject to much criticism • The idea of a utility measure as a rank ordering replaced the idea of cardinal measurement • An “ordinal” measure is a ranking only. • No unit of measurement • Higher numbers imply only more preferred
Preferences If both X and Y provide utility Qy Definitely Preferred to A: U>5 Y’ Definitely Less preferred to A: U<5 Bundle A: X’,Y’ U=5 Qx X’
Indifference Curves A locus of all bundles with the same utility ranking. The consumer is indifferent between them Qy Indifferent between any point on U=5 U>5 (preferred to Any point on U=5) U<5 (any point on U=5 preferred) U=5 Qx
A Preference Map Qy d c a U=6 b U=5 Qx
Preference Maps • In order to draw a preference map at all we are assuming: • goods are infinitely divisible (indifference curves are continuous) • Every combination of goods can be ranked (preferences are complete) • Preferences are consistent (indifference curve cannot intersect or touch)
The Shape of Indifference curves • Negative slope (more is preferred to less) • Marginal rate of substitution (MRS) • Convex to the origin (diminishing marginal rate of substitution) • MRS=ΔQy/ΔQx keeping utility constant—slope of the indifference curve
Maximizing Utility Once Again • In the ordinal utility context maximizing utility means choosing that bundle of goods that is on the highest indifference curve achievable with given income and prices • Budget line: I = PyQy+PxQx PyQy = I- PxQx Qy = I/Py – (Px/Py)Qx I/Py is the Y intercept Px/Py is the slope of the budget line
Budget line Qy I/Py I = PyQy+PxQx I/Px Qx Px/Py is the slope of the budget line
Utility Maximization:Indifference Curves Qy Highest indifference curve achievable Qy* U=6 U=5 U=4 Qx* Qx Budget line and indifference curve are tangent. On budget line and highest indifference curve where MRS=Px/Py
Changes in Income • Changes in income with constant prices will shift the budget line outwards in a parallel fashion • Normal goods will show increased consumption with higher income • Inferior goods will show decreased consumption with higher income • Consumer preferences determine if a good is normal or inferior (shape of indifference curves)
Income Effect Qy I” X and Y normal I’ Income consumption line U” U’ Qx Qx’ Qx” Qy X inferior, Y normal U” I” I’ U’ Qx Qx” Qx’
Changes in Price • Change in the price of X changes the slope of the budget line by changing the X intercept Qy Px’>Px” I/Py Qx I/Px” I/Px’
Price Effect and Demand Curves Qy Budget line with Px’ Budget line with Px” U” U’ Qx Qx’ Qx” Px Px’ Px” Demand curve for X Qx Qx’ Qx”
Income and Substitution Effects of a Price Change • The effect of a price change on the demand for a good can be decomposed into two effects • The substitution effect is the effect of the change in relative prices keeping real income (utility) constant • The income effect is the effect on real purchasing power of the price change
Income and Substitution Effects of a Price Change Qy Overall effect (a to b) can be broken down into a substitution and income effect a b s Qx’ Qx” Qxs Qx Sub Inc
Income and Substitution Effects of a Price Change • Income effects of a price change are usually small--unless the good accounts for a high proportion of expenditure • For normal goods the income effect works to reinforce substitution effect and a price decline must increase quantity demanded • For inferior goods the income effect works against the substitution effect, but the substitution effect is usually larger
Income and Substitution Effects of a Price Change • What does it take to get an upward sloping demand curve? The “Giffen” good case • Giffen goods must be both inferior and important in the budget • Very unlikely to come across a Giffen good • Policy uses of income and substitution effects--carbon taxes and income tax rebates