Soviet Union
Soviet Union. Communism in economics. Is not about quality but quantity . Soviet Union’s Economy . From 1966 to 1970 under Leonid Brezhnev the Gross National Product (GNP) grew at a rate of around 5.3 percent per year.


Soviet Union
E N D
Presentation Transcript
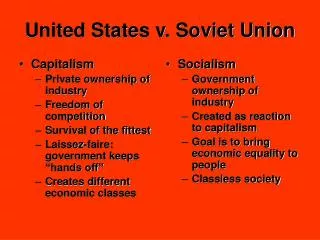
Communism in economics • Is not about quality but quantity
Soviet Union’s Economy • From 1966 to 1970 under Leonid Brezhnev the Gross National Product (GNP) grew at a rate of around 5.3 percent per year. • Then during 1971 to 1975 the growth declined to an average of 3.7 percent per year. And after 1975 the GNP fell to a growth of between 2.6 and 2.7 percent per year. In these years production around the world was growing rapidly, rising to an average annual rate for the world of 6.2 percent in 1973 • The period of 1975–1980 experienced a growth rate of between 1% and 1.9%
1980–1985 saw a further decline in economic growth, between 0.6% and 1.8%
export • Chemicals • Gold • Military Arsenal • Petroleum products • Alcohol beverages
import • food • Industrial tools
production • In 1960 the Soviet Union was producing 12.5 percent of the world's goods • The Soviet Union was keeping up with the United States in the production of steel, pig iron, cement and oil, but the future lay in electronics and specialty chemicals. • From the 1960s a shift had been taking place in work. It was more toward the production of consumer items such as automobiles, electronic devices, pharmaceuticals, civilian aircraft -- a production that was more knowledge intensive, more plastic and less cement.
The Soviet Union's biggest customer for its manufactured goods was its military, and manufacturing for the military continued to use the Soviet Union's most skilled people, to the detriment of production for civilians. • The world’s leading producer of steel and oil
Russian economy overview • GDP: $2.373 trillion (2011 est.) country comparison to the world: 7 • GDP - composition by sector: agriculture- 4.2%industry- 37%, services- 58.9% (2011 est.) • Unemployment rate:6.8% (2011 est.) • The unemployment rate in Russia was last reported at 6.6 percent in January of 2012.
Year GDP % Growth • 1992 1,170.925 N/A • 1993 1,092.674 -8.7 • 1994 974.005 -12.7 • 1995 953.528 -4.1 • 1996 936.706 -3.6 • 1997 966.589 1.4 • 1998 925.701 -5.3 • 1999 999.437 6.4 • 2000 1,123.181 10 • 2001 1,207.134 5.1 • 2002 1,284.333 4.7 • 2003 1,407.759 7.3 • 2004 1,548.717 7.2 • 2005 1,697.957 6.4 • 2006 1,888.266 7.7 • 2007 2,099.663 8.1 • 2008 2,264.608 5.6 • 2009 2,126.390 -7.5 • 2010 2,211.450 4
Exports - commodities: petroleum and petroleum products, natural gas, metals, wood and wood products, chemicals, and a wide variety of civilian and military manufactures • Imports - commodities: machinery, vehicles, pharmaceutical products, plastic, semi-finished metal products, meat, fruits and nuts, optical and medical instruments, iron, steel
1998 crisis • Caused by: • Difficulties in implementing fiscal reforms aimed at raising government revenues • a dependence on short-term borrowing to finance budget deficits • Lower prices for Russia's major export earners (oil and minerals)
The 2008 crisis • Caused by: • oil prices 2. a crisis in its stock market, by mid-September, Russia’s stock market had collapsed 3. firms relied on dried up.
Production: agriculture • Decrease in agriculture labor force during the 1990s • Agriculture is the most lagging ecomonic sector • Agriculture - products: grain, sugar beets, sunflower seed, vegetables, fruits; beef, milk
Production: industries • 2nd largest coal reserves • largest natural gas reserves • 8th largest crude oil reserves • 3rd largest exporter of steel and primary aluminum. • Natural gas - exports: 199.9 billion cu m (2010 est.) country comparison to the world: 1 • Oil - exports:5.01 million bbl/day (2010 est.) country comparison to the world: 2 Other industries: agricultural machinery, shipbuilding, machines building, communication equipments, defense industries and textiles
Taxes • The income tax rate is a flat 13 percent • The top corporate tax rate is 20 percent. • Other taxes include a value-added tax (VAT) and an environmental tax • The overall tax burden amounting to 34.4 percent of total domestic income.