Download
1 / 49
490 likes | 671 Vues
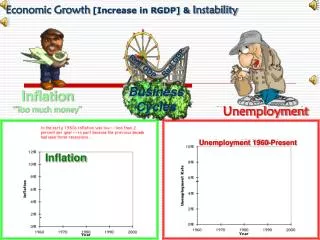
Economic Growth [Increase in RGDP] & Instability. Real GDP. Real GDP. Business Cycles. Inflation “Too much money”. Unemployment. Unemployment 1960-Present. Inflation. One cycle [average 5 yrs]. Four Phases of the Business Cycle. Peak. Real GDP per year. Peak. Recovery.

E N D
Economic Growth [Increase in RGDP] & Instability . Real GDP Real GDP Business Cycles Inflation “Too much money” Unemployment Unemployment 1960-Present Inflation
One cycle [average 5 yrs] Four Phases of the Business Cycle Peak Real GDP per year Peak Recovery Recession Trough Time Peak:real GDP reaches its maximum. Recession:real GDP declines 6 months. Trough:real GDP reaches its minimum. Recovery:an upturn - real GDP rises.
Four Phases of Business Cycle Characteristics of Expansions and Recessions Expansions 1. Less unemployment 2. Increase in real GDP 3. Rapid job growth 4. Increasing interest rate 5. Increasing prices 6. Fewer social problems (alcoholism, domestic violence, divorce, and suicides) Recessions 1. More unemployment 2. Decrease in Real GDP 3. Reduced job growth 4. Lower interest rates 5. Decreasing prices 6. More social problems (alcoholism, domestic violence, divorce and suicide)
Unemployment,Inflation, &Business Cycles Inflation – “too many dollars chasing too few goods.” Deflation – “too few dollars chasing too many goods.”
Recession- contraction for 2 quarters There have been 11 recessions since World War II. They haverangedfrom 6 monthsto 16 months, averaging 10 months.Expansionsaverage about5 years. Recessionsusually cost the layoff of 1 out of every 20 workers[1 out of every 4 or 5 families]. The other 19 are better off because interest rates go down. There has been a recessionevery decade for over 200 years.
Trough – pit of a recession Trough(“base”) – demand, production and unemployment are at their lowest point. Real GDP begins to increase again. A trough marks the “pit of a recession”, but – the start of an expansionary phase of the business cycle. The Fed lowers interest rates. The trough is “bad news”and “good news.” It is the bottom of the “valley” of the downturn and the foot of the “hill” of expansion.
The Great Depression [How Bad?] 100,000 businesses failed. Stock values fell from $89 billion to $15 billion. From 381 to 41. $74 billion was lost. 25% unemployment rate [15 million](125 million in the U.S.) [Unemployment was 3% in 1929.] Unemployment stayed above 14.3% from 1931-1940. Average unemployment was 18% 10,797 banks failed out of over 25,000, taking the life savings of 9 million people.
The Great Depression [continued] Apple sellers could make $1.15 profit on 72 sold apples. Many factory wages went from .55 an hour to .05 an hour. Agriculture collapsed. Prices and wages dropped around 25%. Factory production dropped 50%. Auto production fell from 4.5 million cars in 1929 to 1.1 million in 1933. Those who checked into hotels were asked, “For sleeping or jumping”?
Great Depression Stats [In 1958 dollars] • YearUnemplReal GDP“C”“Ig”“G”In.RateInflation • 3.2 203.6 139.6 40.4 22.0 5.9 ___ • 8.9 183.5 130.4 27.4 24.3 3.6-2.6 • 16.3 169.5 126.1 16.8 25.4 2.6 -10.1 • 24.1 144.2 114.8 4.7 24.2 2.7 -9.3 • 1933 25.2 141.5 112.8 5.3 23.3 1.7 - 2.2 • 22.0 154.3 118.1 9.4 26.6 1.07.4 • 20.3 169.5 125.5 18.0 27.0 0.8 0.9 • 17.0 193.2 138.4 24.0 31.8 0.8 0.2 • 14.3 203.2 143.1 29.9 30.8 0.9 4.2 • 19.1 192.9 140.2 17.0 33.9 0.8-1.3 • 17.2 209.4 148.2 24.7 35.2 0.6 -1.6 • 1940 14.6 227.2 155.7 33.0 36.4 0.6 1.6 -20% -23% -30% -87%
Base year[$50/$50=1x100= 0] $46/$50x100=92[deflation of 8%] FORMULAS Price of Market Basket(2001)[nominal GDP]$64 GDP Price Index = Price of sameMarket Basket(1998)x100;[Real GDP] $50x100=128 [GDP Deflator] in the base year (1998)[$64/128 x 100 = $50] $6,737[1994]/126.1[1987($4,540)]x100 =$5,343[+$803.] “RealGDP deflatesnominal GDPto actual value”[takes theairout of thenominal balloon] Unemployment5,655,000 Labor Force x 100 = unemployment rate;140,863,000 x 100 = 4% [Employed + unemployed][135,208,000+5,655,000] [2000] Okun’sLaw or GDP gap)=Unemployment Rate over 6% x 2%; 7.5%, so 1.5x2% =3%. Or, $3 billion GDP Gap[$100 billion nominal GDP x .03% = $3 billion]. (2000-later year) (1999-earlier year)[*Change/original x 100] Current year’s index – last year’s index172.2-166.6(5.6) C.P.I.= Last year’s index(1999-earlier year) x 100; 166.6 x100 = 3.4% _________________________ “Rule of 72”= % annual rate of increase (3%) = 24 years 72 “Real Income”measures the amount of goods/services nominal income will buy. [%change in real income = % change in nominal income -% change in PL.] 5%10%5%
Indicators of the Business Cycle[“The leading indicators have predicted 11 of the last 15 recessions”] “Barometer Of The Future” [6-9 months] “Where we are heading” Leading Indicators Avg. work week Building permits Credit Delivery times New orders Inventories New businesses Materials prices Stock prices Money supply New orders Unemployment claims Had a recession in 2001 A drop for three straight months usually indicates a recession is coming.
Indicators of the Business Cycle “Where we are now” • Coincident Indicators • Personal income minus transfer payments • Nonagricultural payrolls • Industrial production • Manufacturing and trade sales
Indicators of the Business Cycle “Where we have been” Lagging Indicators Labor cost, unemployment rate & duration, prime rates, CPI for services, commercial loans
History of Inflation, 1860-2006 $21 $7 2006 $11 $1.50
Inflation Since 1954 Above about 2.0% inflation is considered too much. [4.1% in 2005] Take some money out of circulation to make it more valuable. Up in 2004 Tomatoes 50% Fuel Oil 40% Butter 28% Gasoline 26% Home gas 16% Chicken 8% Col. Tuition 9% Sausage 7% Sportstickets 7% Down in 2004 Eggs -20% PCs -14% Photos -14% TVs -12% Lettuce -8% Toys -6% Cars -4% Girls cloth -1% Inflation – overall increase in prices Deflation – decrease in prices (1954) Disinflation – decrease in inflation(1980-83)
Demand-Pull & Cost-Push Inflation Demand-Pull Inflation – increase in AD. [“Too many dollars chasing too few goods”] Originates from “buyers side of the market” D1 D2 S P2 P1 “Demand-pull” D S2 S1 PL2 PL1 Cost-Push Inflation – 3 things may cause “cost-push” inflation. 1. Wage-push– strong labor unions 2. Profit-push– companies increase prices when their costs increase. 3. Supply-side cost shocks– unanticipated increase in raw materials such as oil. “Cost-push” “Wage-price” Spiral
Who wins/loses with 20% Unanticipated Inflation?[Creditors, Debtors, Savers] • The debtor wins with 20%unanticipated inflation. • (some examples) • In 1914, total German mortgage debt was $10 billion marks. • In 1923, $10 billion marks was worth 1 cent.All debt was wiped out. • 2. Signed union contracts agreeing to 3% raisesfor next 3 years. • (A $30,000 salary would increase to $32,782 but it would • take $51,840 to buy what $30,000 would buy 3 years before) • 3. Signed union contracts agreeing to COLAs for next 3 years. • (So a $30,000 salary of 3 years ago would now pay $51,840 • which would buy what $30,000 would buy 3 years ago. • 4. Your Econ teacher buys a $300,000 CDfrom the 1st Econ Bank • which pays him 5% interest for the next 3 years. [Saver] • Mr. Econ would earn $47,288 in interest at 5%, however at • 20%, he could earn $218,400.] So the saver loses here.
(Measures of Inflation PPI) 2003 PPI was 5.4 in 2005, highest since 1990. The “core PPI” [no volatile food and energy] was only 1.7%. Prices at the wholesale or production level which are early indicators of inflation. The 2,800 items include prices for raw materials, intermediate goods, and finished goods. The PPI does not include services.
Consumer Price Index (CPI) [CPI measures cost of living relative to a base year[100] The CPI is a market basket of 364 items at 21,000 establishments in 91 cities that the typical householder buys. It does not include exports because we do not buy exports but does include imports. About 55% of the CPI is services.
The “Market Basket” What’s in the CPI’s Basket?
CPI Shortcomings • Substitutes not counted • Quality not considered(airbags) • No discount stores(“outlet bias”) • New items not counted If orange goes from $1.00 to $2.00 & Tomato juice goes from $1 to .80 Plasma “42” “$11,000” a. 1st VCR, the Phillips 1500, the world’s 1st VCR for home use sold for $1,295 but $50 today. They fell in price 70% before entering the CPI. b. First solar powered calculators appeared in 1972 for $120 but didn’t make the CPI until 1978. c. In 2000, a 20-inch LCD TV cost $5,000, today $550. d. Cell phones[The “Brick”]were introduced in 1984 at $3,995. e. The camcorder cost $1,500 in 1987, now under $400. f. HDTV cost $8,000 in 1998. g. 42 inch Plasma TV in 1999 cost $11,000, now $1,500. 1969 Sharp QT-8D Calculator for $475 [4 functions] [First battery-powered electronic calculator]
GDP Deflator – more broad • GDP Deflator includes prices • for all goods thatwe produce: • What householders are buying • What businesses are buying • What the government is buying • What foreigners are buying • [does not include imports because • we don’t produce imports]
PCE (Personal Consumption Expenditures) Price Index This price index is the “personal consumption” component in the quarterly GDP report. It includes purchases of durables, non-durables, and services, including operating expenses of nonprofit institutions, and the values of food, clothing, fuel, housing, and financial services. Unlike the CPI [a “fixed basket”], it takes into account changes in consumer spending (substitutions for higher priced products). The Fed has decided this is a better indicator of inflation than the CPI, PPI, or overall GDP Deflator.
Misery Index Inflation Rate + Unemployment Rate = Misery Index Arthur Okun developed the economic “discomfort index” to summarize the “health of the economy.” Jimmy Carter used it against Gerald Ford and won. Ronald Reagan used it against Carter(20%) and won. Inflation Rate Unemployment Rate Arthur Okun
GDP • GDP can be measured either by total spending on U.S. production or by total income received from that production. • Expenditure approach [C+Ig+G+Xn] • Adds up the aggregate expenditure on all final goods and services produced during that year • Income approach • Adds up the aggregate income earned during the year by those who produce that output
EXPENDITURES APPROACH Personal Consumption Expenditure (C) Gross Private Domestic Investment (Ig) Government Purchases ( G ) Net Exports( Xn) Net Exports (Xn)=Exports (X)–Imports (M) [M represents productionoutside a country]
Eight Things Not Counted in GDP [no production] • Second Hand Sales[no production] • Public/Private Transfer Payments • Purely Financial Transactions • Intermediate Goods 5. U.S. Corporations producing overseas 6. Non-market transactions [household or volunteer work] Underground Economy 7. Illegal business activity 8. Unreported legal business activity
Importance of Real GDP in Determining aRecession Real GDP is Nominal GDP corrected for inflation. Apple GDP Example A country produces 10 apples x $1; GDP = $10 [base year =100] A country produces 10 apples x $1.25; GDP = $12.50 (no recession but worse off) Or, a country produces 9 apples x $1.25; GDP=$11.25 (recession but nominal GDP is up)
Nominal[money]GDPv. Real GDP An increase in prices and/or output will increase nominal GDP. Only an increase in output will increase real GDP. Nominal GDP could increase even if output falls. Real GDP = Nominal Y/GDP deflator x 100 So, nominal GDP measures output & prices. Real measures only output [actual production] Constant (real) GDP v. current (money) GDP
Nominal GDPv. Real GDP Base year[$50/$50=1x100=100] $46/$50x100=92 [deflation of 8%] Price of Market Basket(2001)[nominal GDP]$64 GDP Price Index = Price of same Market Basket(1998)x100;[Real GDP] $50x100=128 [GDP Deflator] in the base year (1998)[$64/128 x 100 = $50] Nominal [Current) GDP v. Real (constant) GDP
The “GDP” Balloon $6,736.9/126.1 x 100 = $5,342.5 Nominal – measured in terms of money. Real – measured in terms of goods/services. takes
Recession[Real, not nominal GDP has declined] Inflation component Real GDP 1990-91
Under 16 and/or institutionalized Not in labor force Employed Unemployed UNEMPLOYMENT Measurement of Unemployment, 2008 84,200,000 Total Population 304,000,000 76,000,000 139,600,000 Labor force 149,800,000 10,200,000
Full Employment = 4-6% unemployment Wish I had not dropped out of H.S.. Will work For Food Discouraged workers– those who have given up. Unemployed workers- those who are actively looking. Part-time workers– half employed, half unemployed, but counted as fully employed. Employed workers– those who work for even one hour per week for wages or 15 hours a week if not getting paid. We havefull employmentwhencyclical unemployment is “0”.
Survey on Unemployment BLS calls 60,000 households every month. They ask three questions: 1. Are you working? If the answer is no, 2. Did you work at all this month-even 1 day? You are a member of the LF if “yes” on 1 or 2. 3. Did you look for work during the last month? [agency, resume, interview] A “yes” counts you as part of the LF. A “no” means you are not counted. You are a “discouraged worker.” The labor force consists of the employed and unemployed.
Three Types of Unemployment Frictional – “temporary”, “transitional”, “short-term.” (“between jobs” or “search” unemployment) • Examples: • People who get“fired”or “quit” • to look for a better one. • 2. “Graduates” from high school or • college who are looking for a job. • 3. “Seasonal” or weather-dependent jobs such as • “agricultural”, “construction”, “retail”, or “tourism”. • [lifeguards, resort workers, Santas, & migrant workers.] • Frictional unemployment signals that “new jobs” are available • and reflects “freedom of choice”. • These are qualified workers “transferable” skills. “No Job”
2.Structural Unemployment Structural – “technological”or “long term”. There are basic changes in the “structure”of the labor force which make certain “skills obsolete”. Automation may result in job losses. Consumer taste may make a good “obsolete”. The auto reduced the need for carriage makers. Farm machineryreduced the need for farm laborers. “Creative destruction” means as jobs are created, other jobs are lost. Jobs of the future destroy jobs of today. Frictional and Structural make up the “natural rate of unemployment”. “These jobs do not come back.” “Non-transferable skills” – choice is prolonged unemployment or retraining.
3. Cyclical Unemployment Cyclical–“economic downturns”in the business cycle. “Cyclical fluctuations” caused by “deficient AD” “Durable goods jobs” are impacted the most. These can be postponedbecausethey can be repaired. “Cyclical unemployment” is “real unemployment”. “These jobs do come back.”