Download

1 / 7
70 likes | 150 Vues
Explore the global issues surrounding fresh water resources, from historical trends to current challenges such as uneven distribution, usage patterns, contamination, and conflicts. Discover potential solutions for sustainable water management.

E N D
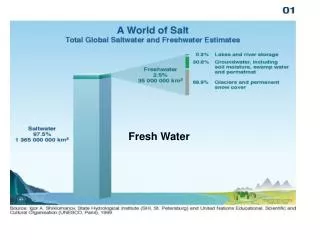
Fresh Water • Historically limiting factor in arid regions • 1940-1990 • World population more than doubled • 2.3 billion 5.3 billion • Per capita water use doubled • 400 m3 person-1 year-1 800 m3 person-1 year-1 • Global water use increased fourfold • 2000: USA ~2000 m3 person-1 year-1 (~1450 galday-1) • Current Status • In 1996, world human population using estimated 54% of all accessible fresh water in rivers, lakes, aquifers • Many people predict disastrous consequences for world’s fresh water supply in coming years • This potential disaster may have several causes
Fresh Water • Current Status • Distribution • Uneven compared to population • 75% of annual rainfall in areas containing less than one-third of global population • Amazon River carries 20% of global runoff through area containing 10 million people • Congo River carries 30% of Africa’s runoff through area containing 10% of population • Uneven in space • North America contains 19,000 m3 per person per year vs. 4700 m3 per person per year in Asia • <10% of Mexico supplies >50% of annual runoff • Uneven in time • India gets 90% of annual rainfall during summer monsoon season (Jun-Sep); runs off too rapidly for efficient use
Fresh Water • Current Status • Usage patterns • Agriculture – 69% • Industry/Energy – 23% • Domestic – 8% • Varies among regions and with development • Africa – 88% for agriculture (irrigation) • Europe – >50% for industry • Japan – Industrial but uses lots of water for growing rice • Spain/Portugal – Arid; water used heavily for agriculture • Personal use tracks standard of living • Africa – 17 m3 year-1 (47 l d-1) • Asia – 31 m3 year-1 (85 l d-1) • UK – 122 m3 year-1 (334 l d-1) • US – 211 m3 year-1 (578 l d-1) • By 2020, water shortages likely in Ethiopia, India, Kenya, Nigeria, China (parts of China already face problems) • Mexico City uses groundwater for 80% of municipal water supply • Depletion exceeds aquifer recharge rate by 50-80% • Sinking of land in some areas Damage to buildings • City imports water to meet demand
Fresh Water • Current Status • Contamination • Numerous examples worldwide • Biggest source = Agriculture • Europe – Over 90% of rivers have elevated nutrient levels from agrochemicals • Hungary – Nearly 40% of well fields contaminated • Developing countries – On average, 90% to 95% of all domestic sewage and 75% of all industrial waste discharged into surface waters without treatment • Impacts • Nile River – Diverting water + retention of sediment behind dams has caused fertile delta to shrink • Rhine River – Lost 8 of 44 fish species; 25 more endangered • Lake Chad – Diversion + drought has caused shrinkage from 25,000 to 2,000 km2 in 30 years Link • Aral Sea – Diversion for agriculture has caused severe shrinkage, with environmental & health problems L1L2
Fresh Water • Consequence – Conflicts • World may have enough fresh water but uneven distribution disputes, though few outright wars • Middle East – Most acute water conflicts • Jordan River Basin • River originates in Lebanon • Water shared by six nations (Wolf et al. 2005) • Israel – 467 m3 person-1 year-1 • Jordan – 224m3 person-1 year-1
Fresh Water • Consequence – Conflicts • Jordan River Basin • 1951 • Jordan announces plans to irrigate Jordan Valley by tapping Yarmuk R. (major tributary) • Israel drains swamps between Israel & Syria • Military clash between Israel & Syria • 1953 • Israel begins construction of National Water Carrier to transfer water from Jordan basin to Negev Desert for irrigation • Syria responds with military action • Israel changes intake to Sea of Galilee • 1965 • Palestinian National Liberation Front attacks diversion pumps operated by Israeli NWC • 1960 • Arab leaders agree on plan to divert headwater via Yarmuk R. to East Ghor (King Abdullah) Canal (Jordan) • 1965-66 • Syria announces plans to divert headwaters • Military clash between Israel & Syria • 1967 • Israel destroys Arab diversion works on headwaters • Series of events Six-Day War • 1969 • Israel destroys canal built by Jordan