Download
1 / 6
60 likes | 145 Vues
Study on HIWRAP's dual-wavelength measurements over deep storms to validate GPM radar algorithms; demonstrates hail storm effects.

E N D
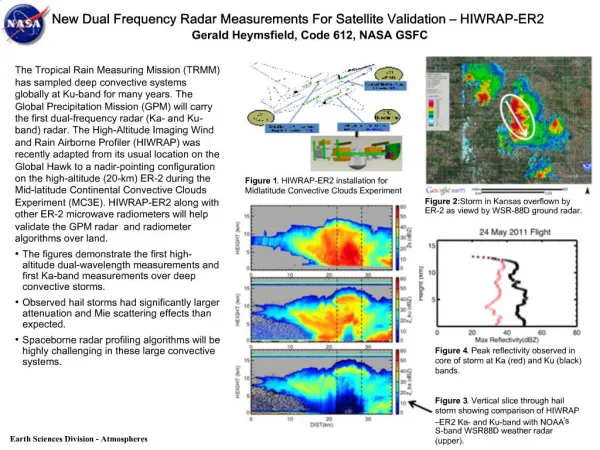
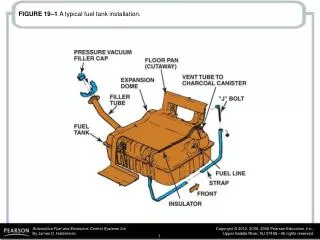
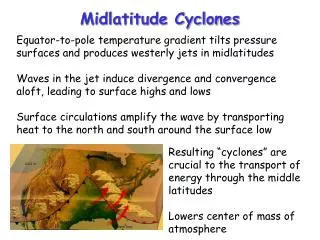
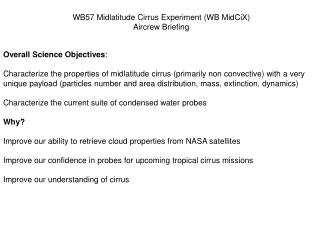
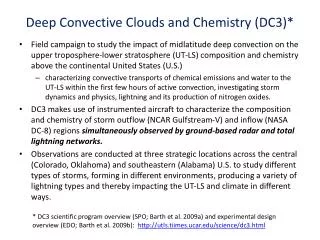
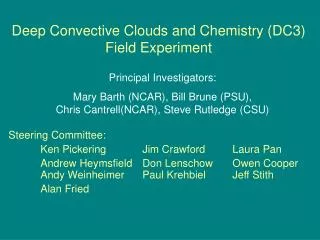
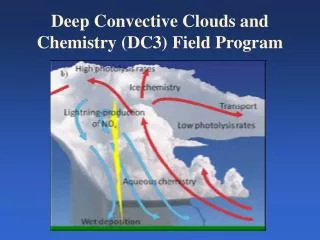
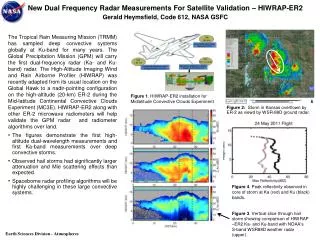
New Dual Frequency Radar Measurements For Satellite Validation – HIWRAP-ER2Gerald Heymsfield, Code 612, NASA GSFC • The Tropical Rain Measuring Mission (TRMM) has sampled deep convective systems globally at Ku-band for many years. The Global Precipitation Mission (GPM) will carry the first dual-frequency radar (Ka- and Ku-band) radar. The High-Altitude Imaging Wind and Rain Airborne Profiler (HIWRAP) was recently adapted from its usual location on the Global Hawk to a nadir-pointing configuration on the high-altitude (20-km) ER-2 during the Mid-latitude Continental Convective Clouds Experiment (MC3E). HIWRAP-ER2 along with other ER-2 microwave radiometers will help validate the GPM radar and radiometer algorithms over land. • The figures demonstrate the first high-altitude dual-wavelength measurements and first Ka-band measurements over deep convective storms. • Observed hail storms had significantly larger attenuation and Mie scattering effects than expected. • Spaceborne radar profiling algorithms will be highly challenging in these large convective systems. Figure 1. HIWRAP-ER2 installation for Midlatitude Convective Clouds Experiment (MC3E) (MC3E). Figure 2: Storm in Kansas overflown by ER-2 as viewd by WSR-88D ground radar. S-band (WSR88D) HIWRAP Ku-band HIWRAP Ka-band Figure 4. Peak reflectivity observed in core of storm at Ka (red) and Ku (black) bands. Figure 3. Vertical slice through hail storm showing comparison of HIWRAP –ER2 Ka- and Ku-band with NOAA’s S-band WSR88D weather radar (upper). Earth Sciences Division - Atmospheres
Name: Gerald Heymsfield, NASA GSFC, Code 612 E-mail: gerald.heymsfield@nasa.gov Phone: 301-614-6369 References: Li, L., G. Heymsfield, J. Carswell, D. Schaubert, M. Mclinden, M. Vega, and M. Perrine, 2011: Development of the NASA High-Altitude Imaging Wind and Rain Airborne Profiler (HIWRAP) for Tropical Storm Research. IEEE Aerospace Conference, Big Sky, Montana, paper 6.0202, 7 pp. Heymsfield, G. M., L. Tian, A. J. Heymsfield, L. Li, and S. Guimond, 2009: Characteristics of deep and subtropical convection from nadir viewing high-altitude airborne radar. Journal of the Atmospheric Sciences, 67, 285-308. Contributors: L. Tian (GESTAR), L. Li (GSFC), M. Mclinden (GSFC), J. Cervantes (SSAI). We acknowledge support for HIWRAP development from the NASA Instrument Incubator Program. The Mid-latitude Continental Convective Clouds Experiment (MC3E) ER-2 flights were sponsored by GPM. Technical Description of Figures: The High-Altitude Imaging Wind and Rain Airborne Profiler (HIWRAP) is a dual-frequency (Ka- and Ku-band) radar that was recently converted to operate on the high-altitude ER-2. HIWRAP-ER-2 is a Doppler radar that measures radar backscatter at frequencies similar to the GPM Dual frequency Precipitation Radar (DPR). It recently participated in the MC3E field experiment in the southern Great Plains along other airborne radiometers, ground-based polarimetric radars, and an in-situ aircraft. Figure 1: The ER-2 payload during MC3E shown with HIWRAP-ER2, COSMIR, and AMPR suite that simulate DPR and GMI (GPM Microwave Imager). HIWRAP-ER2 is located in the ER-2’s left wing pod. Figure 2: Radar display from ground-based WSR-88D radar located at Dodge City, KS (KDDC). The approximate position of the flight line is highlighted and shown by the arrow. This particular storm produced 2-inch hail near the time of the ER-2 overflight, and subsequent storms further south produced tornadoes. Figure 3: Vertical radar reflectivity cross sections from NOAA S-band KDDC (top), and HIWRAP-ER2 (Ku-band, middle, and Ka-band, bottom). Significant attenuation is observed at both Ku- and Ka-band with the Ka-band attenuation occurring below 12 km altitude suggesting the presence of large hail high in the storm. Figure 4: Vertical profiles of maximum reflectivity in the storms core at Ku- and Ka-band. The Ka-band maximum is over 10 dB lower than the Ka-band return suggesting strong attenuation and scattering differences between the two frequencies. The corresponding KDDC reflectivities at S-band reach 70-75 dBZ maximum suggesting the presence of very large hail with dimensions a few inches. Scientific significance: HIWRAP flying on the ER-2 provides a unique capability to study GPM and beyond radar profiling algorithms. HIWRAP-ER measurements along with those from microwave radiometers onboard the ER-2 are extremely useful for GPM algorithm development. In addition, the dual-frequency high-altitude down looking radar measurements from deep land-based convection provide science measurements not obtainable from either current satellites or other manned aircraft. Relevance for future science and relationship to Decadal Survey: HIWRAP-ER2 is at the same frequencies at the Global Precipitation Mission (GPM) radar and it also has one of the frequencies (Ka-band) that is planned for the Aerosol Chemistry Ecosystems (ACE) Decadal Survey Mission. The ER-2 has the capability to carry a host of other remote sensors including the GSFC cloud radar, thereby providing a unique platform for satellite algorithm development and science studies. Earth Sciences Division - Atmospheres
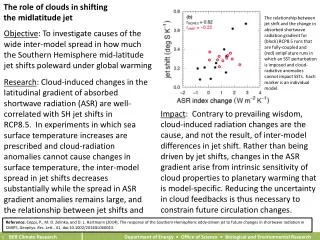
Continual Intercomparison of Radiation Codes (CIRC) to fill critical need Lazaros Oreopoulos and Eli Mlawer The computer codes that calculate the energy budget of solar and thermal radiation in Global Climate Models (GCMs), our most advanced tools for predicting climate change, have to be computationally efficient in order to not impose undue computational burden to climate simulations. By using approximations to gain execution speed, these codes sacrifice accuracy compared the more precise, but also much slower, alternatives. International efforts to evaluate the approximate schemes have taken place in the past, but they have suffered from the drawback that the accurate standards were not validated themselves for performance. In a recent manuscript1 the main results of the first phase of an effort called “Continual Intercomparison of Radiation Codes” (CIRC) were presented. CIRC’s test cases for evaluating the approximate models are based on observations where the accurate models performed well when compared to solar and thermal radiation measurements. The effort is endorsed by international organizations such as GEWEX and the International Radiation Commission and has a dedicated website http://circ.gsfc.nasa.gov where interested scientists can freely download data and obtain more information about the effort’s modus operandi and objectives. N/A 10 5 0 -5 Figure 1:Percentage errors commited by solar radiative transfer (RT) codes (identified only by their index no from 1 to 13) when calculating atmospheric absorption for CIRC Phase I cases. The “A” and “B” indicate simpler version of the main cases 1-7. Blue indicates underestimates Figure 2:Percentage absolute error commited by the solar codes of Fig. 1 when considering collectively reflected, transmitted and absorbed radiation fluxes for all CIRC Phase I cases. -10 The figures above show errors commited by approximate codes calculating solar radiative fluxes when compared to exact reference calcuations. These errors are significantly higher than counterpart errors for infrared radiative fluxes reflecting the greater challenges of shortwave (SW) radiative transfer where aerosol and surface albedo effects have to be carefully accounted for. Fig. 1 shows a map of percentage errors for each CIRC case of atmospheric absorption. Errors tend to be negative (underestimates by the participating codes) across the board, a result that is consistent with several previous studies. A summary of model performance is shown in Fig. 2 where three flux components are considered collectively for all 23 CIRC cases (main cases and subcases) to calculate an ensemble relative error using absolute deviations from the reference fluxes. Only 5 models out of 13 exhibit errors around 1%, while 3 record errors ~5% or above. Earth Sciences Division - Atmospheres
Eli Mlawer, Atmospheric Environment Research Inc. Email: emlawer@aer.com • Name: Lazaros Oreopoulos, Code 613 E-mail: Lazaros.Oreopoulos@nasa.gov Phone: 301-614-6128 • References: • Oreopoulos, L., E. J. Mlawer and coauthors (2012): The Continual Intercomparison of Radiation Codes: Results from Phase I. J. Geophys. Res., under review. • Oreopoulos, L., and E. Mlawer (2010). The Continual Intercomparison of Radiation Codes (CIRC): Assessing anew the quality of GCM radiation algorithms. Bull. Am. Met. Soc., 91, 305-310 doi:10.1175/2009BAMS2732.1. • Oreopoulos L., E. Mlawer, J. Delamere, and T. Shippert (2009). The Continual Intercomparison of Radiation Codes (CIRC): A New Standard for Evaluating GCM Radiation Codes, Proceedings of IRS 2008. • Oreopoulos L., and E. Mlawer (2009). CIRC to Provide Key Intercomparisons of GCM Radiative Transfer Codes Prior to Next IPCC Assessment. GEWEX Feb 09 Newsletter, p.8. • Data Sources: To build the CIRC Phase I cases, a wide range of observations on the state of the atmosphere was compiled from the Atmospheric Radiation Measurement facilities of DOE’s Atmospheric System Research program. In addition, in-situ and satellite measurements of radiative fluxes were used. For the intercomparison itself reference radiative fluxes generated by AER’s line-by-line codes and submissions from participants operating approximate radiative transfer codes were analyzed. • Technical Description of Figures: • Figure 1: Case-by-case percentage errors in atmospheric absorption with respect to accurate shortwave reference calculations commited by each model participating in CIRC. Gray indicates unavailability of submissions and errors outside the colorbar range are assigned the extreme colors of the colorbar. The dominance of blue is a clear indication that virtually all models underestimate solar absorptance, a result that has been discussed extensively before. • Figure 2: The total percentage absolute error commited by each model participating in CIRC Phase I when considering all cases and flux types. This is a compact measure of model performance. • Scientific significance: As previously discussed2, CIRC was conceived as an evolving and regularly updated permanent reference source for evaluation of GCM-class RT codes to support their continual improvement. It seeks to become the standard against which RT code performance is documented in scientific publications and coordinated joint modeling activities. While it is understood that CIRC reference calculations at any time reflect current spectroscopic knowledge and may not be perfect, by keeping CIRC up-to-date with algorithmic and spectral database improvements as they become available, and by gradually expanding the effort with new cases, a valuable service to the radiation modeling community will exist for years to come. The papers referenced above provide the key findings of CIRC that should be addressed by developers of radiation codes for a variety of applications. Without better radiation, doubts about our ability to estimate radiative forcing and accompanying feedbacks in future climatic states will persist. Besides the underestimate in SW absorption shown here, our analysis has revealed that models have difficulty obtaining the correct breakdown of total SW flux to direct and diffuse that may be important for the simulation of chemical or surface processes in climate models, that the number of bands available to resolve spectral surface albedo and other details of wide-band averaging can be important for accurate upward SW fluxes, that SW CO2 forcing, which should be included in all models, needs to be better simulated (CO2 forcing in the thermal is much better), and that the effects of thermal scattering by clouds, albeit significant, exhibit significant discrepancies among models that account for it. • Relevance for future science and relationship to Decadal Survey: Any potential improvements in the representation of key atmospheric constituents in global climate models arising from observations of the decadal survey will be of greater value if associated radiative forcings can be calculated accurately by the radiative transfer codes of these models, a goal which CIRC will help to fulfill. Earth Sciences Division - Atmospheres
Aura/OMI measurements show distinct enhancements in NO2 and SO2 amounts over the Canadian oil sands 90 km LandSat OMI NO2 OMI SO2 1015 molecules/cm2 Landsat detects land use changes (deforestation) over the region of surface mining operations 1015 molecules/cm2 NO2 Trend Location of Oil Sands Data from the Ozone Monitoring Instrument (OMI) show distinct enhancements in nitrogen dioxide (NO2) and sulfur dioxide (SO2) over a region of surface mining in the Canadian oil sands. The oil sands are located in the north-east corner of the province of Alberta, Canada and contain the second largest reserve (after Saudi Arabia) of oil globally. Shown along the top are maps over a portion of the oil sands where extensive surface mining occurs: a NASA LandSat image from 2009 indicating vegetation removal in the region of surface mining (left), OMI mean NO2 (middle), and OMI mean SO2 (right). OMI data were averaged over the period 2005-2010. White values indicate background levels, increasing through yellow-orange, with brown-black the largest. Maximum values clearly correspond to the location of the industrial activity. The time graph shows that NO2 has been increasing at a rate of 10%/year over this period. SO2 trends have not yet been assessed. Maximum NO2 and SO2 values are comparable to those seen over large North American power plants. It is expected that oil production will double and annual capital investments will reach $20B by 2020 further highlighting the need for monitoring pollution in this area. These results make use of improved mapping techniques able to resolve detail down to 10 km. These are the first satellite-based results of pollution over the oil sands. McLinden, C., et al., (2012), Geophysical Research Letters, in press Earth Sciences Division - Atmospheres
Name: Nickolay Krotkov, NASA GSFC, Code 614 & Chris McLinden, Environment Canada E-mail: Nickolay.A.Krotkov@nasa.gov E-mail: Chris.McLinden@ec.gc.ca Phone: 301-614-5553 Phone: 416-739-4594 References: McLinden, C.A., V. Fioletov, K. F. Boersma, N. Krotkov, C. E. Sioris, J. P.Veefkind, and K. Yang, Air quality over the Canadian oil sands: A first assessment using satellite observations (2011), Geophysical Research Letters, in press, 2011GL050273R Boersma, K. F., et al. (2011), An improved tropospheric NO2 column retrieval algorithm for the Ozone Monitoring Instrument, Atmos. Meas. Tech., 4, 1905– 1928, doi:10.5194/amt-4-1905-2011. Krotkov, N.A., S. A. Carn, A. J. Krueger, P. K. Bhartia, and K. Yang (2006), Band residual difference algorithm for retrieval of SO2 from the Aura Ozone Monitoring Instrument (OMI), IEEE Trans. Geosci. Remote Sens., 44, 1259-1266. Data Source: - Tropospheric NO2 data (DOMINO Version 2) from the Dutch/Finnish Ozone Monitoring Instrument (OMI) on board the NASA Aura satellite: (TM4NO2A, version 2, http://www.temis.nl/airpollution/no2.html) - Operational PBL SO2 data from the Dutch/Finnish Ozone Monitoring Instrument (OMI) on board the NASA Aura satellite: http://disc.sci.gsfc.nasa.gov/Aura/data-holdings/OMI/omso2g_v003.shtml - NASA LandSat image obtained from http://earthobservatory.nasa.gov/Features/WorldOfChange/athabasca.php?src=eoa-features Technical Description of Figures: Upper left: NASA LandSat image showing land changes (white color indicates deforestation) in the region of mining operations. Upper middle: OMI annual mean tropospheric NO2 vertical column density (VCD) in units of 1015 molec/cm2, averaged over 2005-2010, shown on a 1x1 km2 grid and calculated using an averaging radius of 8 km. Large NO2 emission sources are Syncrude (left black dot) and Suncor (right black dot). Upper left: OMI summertime mean tropospheric SO2 VCD in units of 1015 molec/cm2, averaged over 2005-2010 shown on a 2x2 km2 grid and calculated using an averaging radius of 24 km. Large SO2 emission sources are Syncrude (left black dot) and Suncor (right black dot). Lower right: Time series of seasonal OMI NO2 total mass of the NO2 enhancement in tonnes, Also shown is the fit to the time series using a trend model with constant, linear, and annual harmonic terms and the calculated linear trend and trend uncertainties. The rate of emission throughout the year is roughly constant, The seasonality of the NO2 is due to its changing chemical lifetime. Significance: This is a first study of the abundance of NO2 and SO2 over the Canadian oil sands, based on UV/visible nadir-viewing satellite instruments. A trend in the mass of the NO2 enhancement–the quantity most representative of NO2 emissions–of 10.4±3.5%/yr (2005-2010) was found to result from increases in both the maximum pollution levels and the total area of the enhancement. SO2 pollution values over the oil sands are similar as those of large power plants. This highlights the importance of satellite observations in providing a macroscopic or comprehensive view. Relevance for future science and relationship to Decadal Survey: Decadal Survey recommended the Geostationary Coastal and Air Pollution Events (GEO-CAPE) tier 2 mission is planned to launch after 2020. It will allow more frequent monitoring of anthropogenic NO2 and SO2 pollution over N. America, including the oil sands region. A next generation, OMI-like sensor is being considered by the Canadian Space Agency for inclusion on the Polar Communication and Weather (PCW) mission scheduled for launch in 2018. It would monitor SO2 pollution over the Arctic and sub-Arctic regions. Earth Sciences Division - Atmospheres