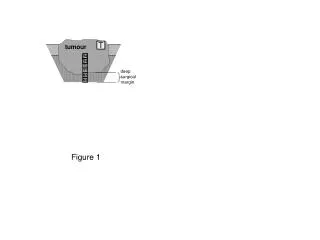
Figure 1
a. d. b. e. c. f. Effect of different induction strength of one chaperone team at constant induction strength of the other chaperone. Figure 1. 80 66 47 40 35 29 17. 1 2 3 4. STD Streptokinase. Degraded Fragments ~35 kDa.


Figure 1
E N D
Presentation Transcript
a d b e c f Effect of different induction strength of one chaperone team at constant induction strength of the other chaperone Figure 1
80 66 47 40 35 29 17 1 2 3 4 STD Streptokinase Degraded Fragments ~35 kDa Western Blot analysis of the degradation pattern of streptokinase observed during the control and chaperone coexpression experiments. Figure 2
Figure 3a Model simulations for 2 fold increase in model parameter values
Figure 3b Model simulations for 2 fold decrease in model parameter values
Comparison of the total 32, total DnaK and free DnaK levels during the two fold increase in model parameters Figure 4 Parameter K6 Parameter K11 Parameter Kmd Parameter Kx2
Comparison of the total 32, total DnaK and free DnaK levels during the two fold decrease in model parameters Figure 5 Parameter K2 Parameter Kx4 Parameter K4 Parameter Kpd