Optimizing Grain Yield in Virginia: Latest Research Findings and Trends
560 likes | 652 Vues
Explore the latest research findings and trends in optimizing grain yield in Virginia. Learn about sensor-based N applications, models for grain yield, and the impact of planting dates on yields. Stay informed on key issues affecting grain production, such as nutrient efficiency and global market trends. Discover opportunities for increasing wheat production and enhancing crop value. Keep up-to-date with current Virginia wheat yield data and future directions for small grain crops.

Optimizing Grain Yield in Virginia: Latest Research Findings and Trends
E N D
Presentation Transcript
160 140 120 100 Grain Yield, bu/ac 80 60 y = 1.2755x - 2445.3 2 40 R = 0.0765 20 0 1985 1990 1995 2000 2005 2010 Virginia Yield Trend +10.7 -8.5 USDA, NASS, 2008
160 140 120 100 Crop Value, Million $ 80 60 40 20 0 1995 1996 1997 1998 1999 2000 2001 2002 2006 2007 1990 1991 1992 1993 1994 2003 2004 2005 Crop Value to Virginia USDA, NASS, 2008
600 500 400 Planted Acres, 1000's 300 200 100 0 1995 1996 1997 1998 1999 2000 2001 2002 2006 2007 1990 1991 1992 1993 1994 2003 2004 2005 Virginia Planted Acres USDA, NASS, 2008
December 2008 Corn CBOT.com 3/12/08
Examples 3000 lb (DM) of Vetch as a cover crop can produce 80 lb N/ac. Cover crop needs to grow until early May to achieve this much DM. How much yield do I give up by planting at this later date?
Delayed Planting? 14.2 200 180 160 4.6 140 120 10-May Modeled Grain Yield, bu/ac 100 20-Apr 80 60 40 20 0 Best yield 75% Median yield 25% Worst yield percentile percentile
What the Sensor “Sees” The vigor of the leaves and the ratio of plant to soil affect NDVI values The vigor of the leaves and the ratio of plant to soil affect NDVI values
Note that the biomass of each plant is observable in NDVI value
Large Scale Strip Trials • Compare grain yields following • sensor-based, variable-rate N • applications and standard in-season N recommendations for Virginia
LB N/AC BU/AC STD 65.6 85.9 GS 61.2 85 STD-GS -4.4 -0.8 LB N/AC BU/AC STD 100 147.9 GS 79.1 148.5 STD-GS -20.9 0.7 The System • Wheat • 16 Studies • Corn • 11 Studies
30 Inch 15 Inch 20 Inch Twin 30 Inch y = -0.0003x + 154.31 y = 0.0009x + 120.08 y = 0.0014x + 110.37 y = 0.0021x + 82.01 R 2 = 0.4189 R 2 = 0.3072 R 2 = 0.6138 R 2 = 0.8312 170 165 160 155 Yield, bu/ac 150 145 140 135 130 25000 27000 29000 31000 33000 35000 37000 39000 Plants/ac
Price Paid to Farmers/Bu Corn USDA, NASS, 2008
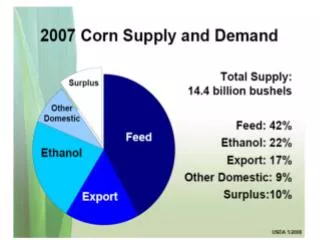
Corn is king -- and therefore a growing problem • Increasing dependence on the grain leaves the U.S. vulnerable to drought-induced price spikes in food and fuel. • Jerry Hirsch, Los Angeles Times March, 2008
In January, China levied export tariffs of 5% for corn, rice and soybeans and 20% for wheat to keep grains from leaving the country. • The Russian government has increased grain export tariffs by 40% - Jan 30, 2008 • Argentina and other nations also are placing tariffs on grain exports to protect their food supplies.
Corn Nutrient Efficiency 3.5 2.89 3.0 2.49 2.5 2.1 1980 2.0 1.65 Bushels of Grain/ lb Fertilizer 1990 1.33 1.5 1.05 1.03 2005 0.84 1.0 0.61 0.5 0.0 Nitrogen Phosphorus Potassium
300000 250000 200000 Production (1000 bu) 150000 100000 50000 0 Texas Virginia Kansas Montana Colorado Nebraska Oklahoma Washington South Dakota US Winter Wheat Production 24th of 42 States USDA, NASS
Virginia Wheat 70 60 50 40 Wheat Value (million $) 30 20 10 0 1990 1991 1992 1993 1994 1995 1996 1997 1998 1999 2000 2001 2002 2003 2004 2005 2006 USDA, NASS
Virginia Wheat Yield USDA, NASS USDA, NASS
World Wheat Stocks 40 Production Disappearance 35 30 25 Stocks:Use Ratio 20 15 Lowest since 1948 10 5 0 2002 2003 2004 2005 2006 2007 2008 FAO
Future directions for VA • Increased Value Small Grain Crops • Bread Wheat • Durum Wheat • Other IP Wheat Opportunities • Strong gluten • Super soft • Hulless Barley
Survey What price/bushel level would it take for you to re-introduce wheat on your farm or increase wheat acreage? 6% $3.50-3.75 28% $3.76-4.00 48% $4.01 + 17% Do not plan to grow wheat regardless of price
Wheat Prices, CBOT & KCBOT AVG. of $0.40/bu or more
2006 – ~ 2.2 M bushels of SRW ~ 5 M bushels HRW
2007 – ~ 10.5 M bushels/year ~ 6 M bushels Durum
Durum and Soft Red Winter Wheat Durum wheat is over $21 per bushel today!
Higher Starch Higher Protein Lower Ash Lower Fiber Hulless Barley
Results: Hulless Versus Hulled Barley Fermentations (No b-Glucanase Added)
Worldwide Wheat • Grain Contamination • Pesticide Residue Thresholds • Insects • Disease • End-use Quality • GMO Wheat
GMO Wheat • 2002-2003 • Roundup Ready - Hard Red Spring Wheat • NAWG claims markets will be lost • June 2004 – Monsanto withdraws application • Segregation
GMO Wheat – Current & Future • Roundup Ready • Monsanto • Approved in US but withdrawn due to industry concerns • Fusarium Head Blight Resistance • Syngenta • Field trials complete, not submitted for approval • Available 2013 ? • Drought? • Grain Quality? • Nitrogen Efficiency?