Yield Pyramid
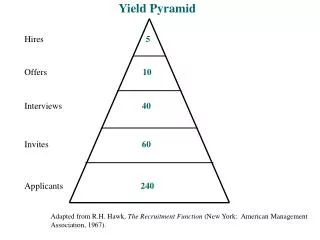
Yield Pyramid. Hires 5. Offers 10. Interviews 40. Invites 60. Applicants 240.

Yield Pyramid
E N D
Presentation Transcript
Yield Pyramid Hires 5 Offers 10 Interviews 40 Invites 60 Applicants 240 Adapted from R.H. Hawk, The Recruitment Function (New York: American Management Association, 1967).
Recruitment Sources (Techniques) • In-House (e.g., hiring or promotion from within the organization) • Newspapers, Trade/Professionals Publications • Outside Companies (Headhunters, Employment/Temp Agencies, Executive Search Firms • Job or College Fairs • Internet-based • Private sites (e.g., Monster) • Professional Organizations • Company web site
Some Factors in Considering Recruiting Sources • Cost • Time Requirements • Number and Quality of Applicants • Type of Job (e.g., manual labor, managerial) • Type of Applicant (knowledge, skills, demographic and minority representation
Test Utility Key Points Job openings Selection Ratio (SR) = n N Applicants Test Validity [Criterion-related]: The extent to which test scores correlate with job performance scores [Range is from 0 to 1.0]
(SR) Proportion of “Successes” Expected Through the Use of Test of Given Validity and Given Selection Ratio, for Base Rate .60. (From Taylor & Russell, 1939, p. 576) Selection Ratio Validity .05 .10 .20 .30 .40 .50 .60 .70 .80 .90 .95 .00 .60 .60 .60 .60 .60 .60 .60 .60 .60 .60 .60 .05 .64 .63 .63 .62 .62 .62 .61 .61 .61 .60 .60 .10 .68 .67 .65 .64 .64 .63 .63 .62 .61 .61 .60 .15 .71 .70 .68 .67 .66 .65 .64 .63 .62 .61 .60 .20 .75 .73 .71 .69 .67 .66 .65 .64 .63 .62 .61 .25 .78 .76 .73 .71 .69 .68 .66 .65 .63 .62 .61 .30 .82 .79 .76 .73 .71 .69 .68 .66 .64 .62 .61 .35 .85 .82 .78 .75 .73 .71 .69 .67 .65 .63 .62 .40 .88 .85 .81 .78 .75 .73 .70 .68 .66 .63 .62 .45 .90 .87 .83 .80 .77 .74 .72 .69 .66 .64 .62 .50 .93 .90 .86 .82 .79 .76 .73 .70 .67 .64 .62 .55 .95 .92 .88 .84 .81 .78 .75 .71 .68 .64 .62 .60 .96 .94 .90 .87 .83 .80 .76 .73 .69 .65 .63 .65 .98 .96 .92 .89 .85 .82 .78 .74 .70 .65 .63 .70 .99 .97 .94 .91 .87 .84 .80 .75 .71 .66 .63 .75 .99 .99 .96 .93 .90 .86 .81 .77 .71 .66 .63 .80 1.00 .99 .98 .95 .92 .88 .83 .78 .72 .66 .63 .85 1.00 1.00 .99 .97 .95 .91 .86 .80 .73 .66 .63 .90 1.00 1.00 1.00 .99 .97 .94 .88 .82 .74 .67 .63 .95 1.00 1.00 1.00 1.00 .99 .97 .92 .84 .75 .67 .63 1.00 1.00 1.00 1.00 1.00 1.00 1.00 1.00 .86 .75 .67 .63 Note: A full set of tables can be found I Taylor and Russell (1939) and in McCormick and Ilgen (1980, Appendix B).
Selection RatioExample Mean Standard Criterion Score of Accepted Cases in Relation to Test Validity and Selection Ratio (From Brown & Ghiselli, 1953, p. 342) Validity Coefficient Selection Ratio .00 .05 .10 .15 .20 .25 .30 .35 .40 .45 .50 .55 .60 .65 .70 .75 .80 .85 .90 .95 1.00 .05 .00 .10 .21 .31 .42 .52 .62 .73 .83 .94 1.04 1.14 1.25 1.35 1.46 1.56 1.66 1.77 1.87 1.98 2.08 .10 .00 .09 .18 .26 .35 .44 .53 .62 .70 .79 .88 .97 1.05 1.14 1.23 1.32 1.41 1.49 1.58 1.67 1.76 .15 .00 .08 .15 .23 .31 .39 .46 .54 .62 .70 .77 .85 .93 1.01 1.08 1.16 1.24 1.32 1.39 1.47 1.55 .20 .00 .07 .14 .21 .28 .35 .42 .49 .56 .63 .70 .77 .84 .91 .98 1.05 1.12 1.19 1.26 1.33 1.40 .25 .00 .06 .13 .19 .25 .32 .38 .44 .51 .57 .63 .70 .76 .82 .89 .95 1.01 1.08 1.14 1.20 1.27 .30 .00 .06 .12 .17 .23 .29 .35 .40 .46 .52 .58 .64 .69 .75 .81 .87 .92 .98 1.04 1.10 1.16 .35 .00 .05 .11 .16 .21 .26 .32 .37 .42 .48 .53 .58 .63 .69 .74 .79 .84 .90 .95 1.00 1.06 .40 .00 .05 .10 .15 .19 .24 .29 .34 .39 .44 .48 .53 .58 .63 .68 .73 .77 .82 .87 .92 .97 .45 .00 .04 .09 .13 .18 .22 .26 .31 .35 .40 .44 .48 .53 .57 .62 .66 .70 .75 .79 .84 .88 .50 .00 .04 .08 .12 .16 .20 .24 .28 .32 .36 .40 .44 .48 .52 .56 .60 .64 .68 .72 .76 .80 .50 .00 .04 .07 .11 .14 .18 .22 .25 .29 .32 .36 .40 .43 .47 .50 .54 .58 .61 .65 .68 .72 .60 .00 .03 .06 .10 .13 .16 .19 .23 .26 .29 .32 .35 .39 .42 .45 .48 .52 .55 .58 .61 .64 .65 .00 .03 .06 .09 .11 .14 .17 .20 .23 .26 .28 .31 .34 .37 .40 .43 .46 .48 .51 .54 .57 .70 .00 .02 .05 .07 .10 .12 .15 .17 .20 .22 .25 .27 .30 .32 .35 .37 .40 .42 .45 .47 .50 .75 .00 .02 .04 .06 .08 .11 .13 .15 .17 .19 .21 .23 .25 .27 .30 .32 .33 .36 .38 .40 .42 .80 .00 .02 .04 .05 .07 .09 .11 .12 .14 .16 .18 .19 .21 .22 .25 .26 .28 .30 .32 .33 .35 .85 .00 .01 .03 .04 .05 .07 .08 .10 .11 .12 .14 .15 .16 .18 .19 .20 .22 .23 .25 .26 .27 .90 .00 .01 .02 .03 .04 .05 .06 .07 .08 .09 .10 .11 .12 .13 .14 .15 .16 .17 .18 .19 .20 .95 .00 .01 .01 .02 .02 .03 .03 .04 .04 .05 .05 .06 .07 .07 .08 .08 .09 .09 .10 .10 .11
Basic Orientation Principles 1) The 1st day on the job is crucial! It is important to manage it well and make it a positive time. Employees remember it for years, particularly if it is an unpleasant experience 2) Impressions formed during the first 60-90 days are difficult to alter. So, it is important to make this time a positive experience for newly-hired employees 3) Ensure that new employees see how their job fits within the framework of the overallorganization. (As such, the organization needs to communicate information about it’s goals and objectives) 4) Avoid ‘information overload.” It’s best to provide the new employee with information in reasonable amounts and in a meaningful sequence 5) Ensure that the new employee’s immediate supervisor is ultimately responsible for the orientation program 6) Social and family adjustment concerns should be addressed in the orientation program
Regression Simple Regression Equation Multiple Regression y = a + bx y = a + b x + b x + b x ….. 1 1 2 2 3 3 Test Score Predicted Score Predicted Score Weights Slope y-intercept y-intercept • Basic Process: • All applicants take every test. • Scores are weighted and combined to yield a predicted score for each applicant. • Applicants scoring above a set cutoff score are considered for hire • Key Points: • Regression is a compensatory approach. That is, a high score on one test can compensate for a low score on another. • Best for tests to not relate to each other, but relate highly to the criterion.
Compensatory Example How Four Job Applicants with Different Predictor Scores Can Have the Same Predicted Criterion Score Using Multiple Regression Analysis Predicted Criterion Score Applicant Score on X Score on X 1 2 A 25 0 100 B 0 50 100 C 20 10 100 D 15 20 100 Note: Based on the equation Y = 4X + 2X. 1 2
Independent Predictors r r 1c 2c Predictor 1 Criterion Predictor 2 • 2 2 • 2 2 2 R = r + r For example, if r = .60 and r = .50, then R = (.60) + (.50) = .36 + .25 = .61 c.12 1c 2c 1c 2c c.12
Interrelated Predictors Criterion r r 1c 2c r 12 Predictor 1 Predictor 2 2 2 r r - 2r r r 1c 2c 12 1c 2c 2 R = c.12 1 - r 2 12 For example, if the two predictors intercorrelate .30, given the validity coefficients from the previous example And r = .30, we will have 12 2 2 (.60) + (.50) - 2(.30)(.60)(.50) 2 R = = .47 c.12 1 – (.30) 2
Multiple Cutoff Approach Paper & Pencil Math Test 100 Paper & Pencil Aptitude Test 100 WAB 100 Pass Pass Pass Cutoff score Cutoff score Cutoff score Fail Fail Fail 0 0 0 • Basic Process: • All applicants take every test. • Applicant must achieve a passsing score on every test to be considered for hire. • Key Point:A multiple cut-off approach can lead to different decisions regarding who to hire versus using a regression approach.
Multiple Hurdle Approach Work Sample Test 100 Paper & Pencil Knowledge Test 100 Interview 100 Cutoff score Pass Pass Pass Cutoff score Cutoff score Fail Fail Fail Eliminated from the selection process Eliminated from the selection process 0 Eliminated from the selection process 0 0 • Basic Process: • All applicants take the 1st test. • Pass/fail decisions are made on the 1st and subsequent tests and only those who pass can continue on to the next test [a sequential process]. • Key Point: • Useful when a lengthy, costly, and complex training process is required for the position.