Download
1 / 27
270 likes | 429 Vues
Graphical Displays of Information. Chapter 3.1 – Tools for Analyzing Data Mathematics of Data Management (Nelson) MDM 4U . Histograms. Show: Continuous data grouped in class intervals How data is spread over a range Bin width = width of each bar

E N D
Graphical Displays of Information Chapter 3.1 – Tools for Analyzing Data Mathematics of Data Management (Nelson) MDM 4U
Histograms • Show: • Continuous data grouped in class intervals • How data is spread over a range • Bin width = width of each bar • Different bin widths produce different shaped distributions • Bin widths should be equal • Usually 5-6 bins
Histogram Example • These histograms represent the same data • One shows much less of the structure of the data • Too many bins (bin width too small) is also a problem
Histogram Applet – Old Faithful http://www.stat.sc.edu/~west/javahtml/Histogram.html
Bin Width Calculation • Bin width = (range) ÷ (number of intervals) • where range = (max) – (min) • Number of intervals is usually 5-6 • Bins should not overlap • wrong: 0-10, 10-20, 20-30, 30-40, etc. • Discrete • correct: 0-10, 11-20, 21-30, 31-40, etc. • correct: 0-10.5, 10.5-20.5, 20.5-30.5, etc. • Continuous • correct: 0-9.9, 10-19.9, 20-29.9, 30-39.9, etc. • correct: 0-9.99, 10-19.99, 20-29.99, 30-39.99, etc.
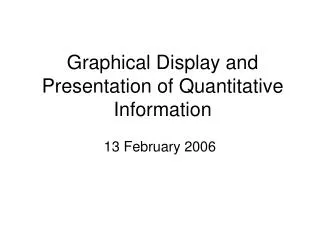
Mound-shaped distribution • The middle interval(s) have the greatest frequency (i.e. the tallest bars) • The bars get shorter as you move out to the edges. • E.g. roll 2 dice • 75 times
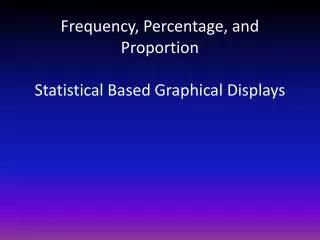
U-shaped distribution • Lowest frequency in the centre, higher towards the outside • E.g. height of a combined grade 1 and 6 class
Uniform distribution • All bars are approximately the same height • e.g. roll a die 50 times
Symmetric distribution • A distribution that is the same on either side of the centre • U-Shaped, Uniform and Mound-shaped Distributions are symmetric
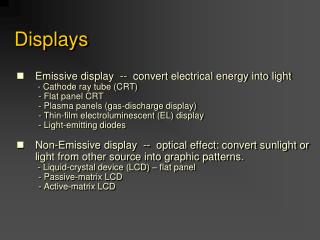
Skewed distribution (left or right) • Highest frequencies at one end • Left-skewed drops off to the left • E.g. the years on a handful of quarters
MSIP / Homework • Define in your notes: • Frequency distribution (p. 142-143) • Cumulative frequency (p. 148) • Relative frequency (p. 148) • Complete p. 146 #1, 2, 4 , 9, 11 (data in Excel file on wiki),13
Warm up - Class marks • What shape is this distribution? • Which of the following can you tell from the graph: mean? median? mode? • Left-skewed • Mean < median < mode • Modal interval: 76 • (Median: 70) • (Mean: 66)
Measures of Central Tendency Chapter 3.2 – Tools for Analyzing Data Mathematics of Data Management (Nelson) MDM 4U
Sigma Notation • the sigma notation is used to compactly express a mathematical series • ex: 1 + 2 + 3 + 4 + … + 15 • this can be expressed: • the variable k is called the index of summation. • the number 1 is the lower limit and the number 15 is the upper limit • we would say: “the sum of k for k = 1 to k = 15”
Example 1: • write in expanded form: • This is the sum of the term 2n+1 as n takes on the values from 4 to 7. • = (2×4 + 1) + (2×5 + 1) + (2×6 + 1) + (2×7 + 1) • = 9 + 11 + 13 + 15 • = 48 • NOTE: any letter can be used for the index of summation, though a, n, i, j, k & x are the most common
The Mean • Found by dividing the sum of all the data points by the number of elements of data • Affected greatly by outliers • Deviation • the distance of a data point from the mean • calculated by subtracting the mean from the value • i.e.
The Weighted Mean • where xi represent the data points, wi represents the weight or the frequency • “The sum of the products of each item and its weight divided by the sum of the weights” • see examples on page 153 and 154 • example: 7 students have a mark of 70 and 10 students have a mark of 80 • mean = (70×7 + 80×10) ÷ (7+10) = 75.9
Means with grouped data • for data that is already grouped into class intervals (assuming you do not have the original data), you must use the midpoint of each class to estimate the weighted mean • see the example on page 154-5 and today’s Example 4
Median • the midpoint of the data • calculated by placing all the values in order • if there is an odd number of values, the median is the middle number • 1 4 6 8 9 median = 6 • if there are an even number of values, the median is the mean of the middle two numbers • 1 4 6 8 9 12 median = 7 • not affected greatly by outliers
Mode • The number that occurs most often • There may be no mode, one mode, two modes (bimodal), etc. • Which distributions from yesterday have one mode? • Mound-shaped, Left/Right-Skewed • Two modes? • U-Shaped, some Symmetric • Modes are appropriate for discrete data or non-numerical data • Eye colour • Favourite Subject
Distributions and Central Tendancy • the relationship between the three measures changes depending on the spread of the data • symmetric (mound shaped) • mean = median = mode • right skewed • mean > median > mode • left skewed • mean < median < mode
What Method is Most Appropriate? • Outliers are data points that are quite different from the other points • Outliers affect the mean the greatest • The median is least affected by outliers • Skewed data is best represented by the median • If symmetric either median or mean • If not numeric or if the frequency is the most critical measure, use the mode
Example 3 • a) Find the mean, median and mode • mean = [(1x2) + (2x8) + (3x14) + (4x3)] / 27 = 2.7 • median = 3 (27 data points, so #14 falls in bin 3) • mode = 3 • b) What shape does it have? • Left-skewed
Example 4 • Find the mean, median and mode • mean = [(145.5×3) + (155.5×7) + (165.5×4)] ÷ 14 = 156.2 • median = 151-160 or 155.5 • mode = 151-160 or 155.5 • MSIP / Homework: p. 159 #4, 5, 6, 8, 10-13
MSIP / Homework • p. 159 #4, 5, 6, 8, 10-13
References • Wikipedia (2004). Online Encyclopedia. Retrieved September 1, 2004 from http://en.wikipedia.org/wiki/Main_Page