Download
1 / 11
110 likes | 253 Vues
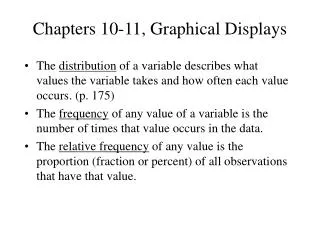
This guide explores various statistical graphical displays, including frequency polygons, stem-and-leaf plots, time-series plots, and pie charts. A frequency polygon connects points plotted from frequency data, illustrating distributions alongside histogram bars. Stem-and-leaf plots present data by separating values into stems and leaves, while time-series plots visualize data trends over time with line segments. Pie charts effectively represent categorical data as slices of a circle. Each method offers unique insights into data analysis.

E N D
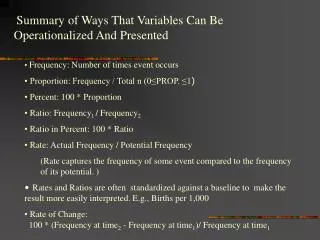
Frequency, Percentage, and ProportionStatistical Based Graphical Displays
Frequency Polygon • a graph that displays the data using lines to connect points plotted for the frequencies. • The frequencies represent the heights of the vertical bars in the histograms.
Frequency Polygon • Ex: Frequency Polygon superimposed on the weight class histogram.
Stem-and-Leaf Plots • AKA Stem-and-Leaf Displays • part of the data value is used as the stem • forms from the data classes • the remaining part of the data is used as the leaves • forms form the actual data values Consider the following numerical data 96, 98, 107, 110, 112
Stem-and-Leaf Plots Ex: Consider the following numerical data 96, 98, 107, 110, 112
Stem-and-Leaf Plots Ex: Consider the following numerical data 96, 98, 107, 110, 112
Time-Series Plots • AKA Time-Series Graph • displays data that are observed over a given period of time • typically represented as a line segment
Pie Chart • AKA Pie Graph • displays data in a circle that is divided into slices according to the percentage of the data values in each category (qualitative data) or class (quantitative data).