Download
1 / 6
60 likes | 162 Vues
Explore aging experiments at 600°C in a model Ni-7.5 Al-8.5 Cr at.% superalloy through atom-probe tomography and visualization of early phase separation at the nanoscale. Study precipitation behavior in various model superalloys through NSF-funded research.

E N D
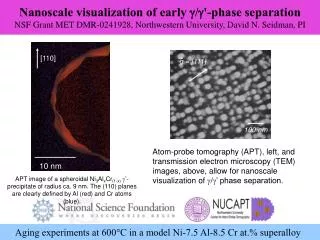
Aging experiments at 600°C in a model Ni-7.5 Al-8.5 Cr at.% superalloy Nanoscale visualization of early g/g'-phase separation NSF Grant MET DMR-0241928, Northwestern University, David N. Seidman, PI [110] g = [111] 100 nm Atom-probe tomography (APT), left, and transmission electron microscopy (TEM) images, above, allow for nanoscale visualization of g/g’ phase separation. 10 nm APT image of a spheroidal Ni3AlxCr(1-x)g’-precipitate of radius ca. 9 nm. The (110) planes are clearly defined by Al (red) and Cr atoms (blue).
Precipitation in a model Ni-6.5 Al-9.5 Cr at.% superalloy aged at 600°C Early g/g'-phase separation: sub-nanometer scale analyses NSF Grant MET DMR-0241928, Northwestern University, David N. Seidman, PI APT image Corresponding composition profiles A high g'-precipitatenumber density (~1024 precipitates m-3) is detected after 4 hours of aging at 600°C with atom-probe tomography (APT) The resulting composition profiles provide further insight into the phase separation behavior.
Precipitation in a Ni-8.5 Al-10 Cr-1.0 Ru-1.0 Re at.% model superalloy Nanostructural temporal evolution in g/g'-phase separation NSF Grant MET DMR-0241928, Northwestern University, David N. Seidman, PI Atom-probe tomograph (APT) images of a Ni-8.5 Al-10 Cr-1.0 Ru-1.0 Re at.% model superalloy aged at 600ºC for 15 minutes, acquired on the 3-D LEAP™ tomograph at the Northwestern University Center for Atom-Probe Tomography (NUCAPT). The morphologies of the g’-precipitates are found to be a mixture of spheroidal and interconnected precipitates. - Courtesy of Ms. Gillian Hsieh, an R.E.U. student working with the group.
The Kinetic Pathway for Coarsening in a Ni-Al-Cr alloy by Lattice Kinetic Monte Carlo Simulation NSF Grant MET DMR-0241928, David N. Seidman, PI [100] [110] [100] [100] [100] [110] [110] [110] The kinetic pathway of coarsening in a Ni-5.24at.%Al-14.24 at.%Cr alloy is strongly dependent on long-range solute-vacancy binding energies. LKMC 1 Long-range solute-vacancy binding No long-range solute-vacancy binding LKMC 2 LKMC 1 - coagulation-coalescence LKMC 2 - classic evaporation-condensation Concentration profiles as a function of distance from the g/g’ interface, right-side. Experimental 3-D APT reconstructions follow LKMC 1 trajectories, which has long-range vacancy-solute binding energies out to fourth nearest neighbor.
Ni-Cr-Al-Ru Ni-Cr-Al-Ru-Re Ni-Cr-Al-Ru-Re-W Effects of Ru, Re, or W on Model Ni-base Superalloys (2) NSF Grant MET DMR-0241928, Northwestern University, David N. Seidman, PI [110] 100 nm 10 nm Compositional evolution of g’-precipitates in Ni-8.5Cr-10Al-2Ru, Ni-8.5C5-10Al-1Ru-1Re and Ni-8.5C5-10Al-.5Ru-.5Re-1W (at.%) during aging at 800oC for up to 256 hours. Partitioning ratio, K, of an element is given by precipitate’s concentration of an element divided by matrix concentration the same element. Compositions measured by atom-probe analysis are all in atomic percent. Dependence of Compositional Evolution at 800°C on Ru, Ru-Re, or Ru-Re-W additions
Ru RuRe RuReW 100nm 4 h 4 h 16 h 16 h 64 h 64 h 256 h 256 h Effects of Ru, Re, or W on Model Ni-base Superalloys (1) NSF Grant MET DMR-0241928, Northwestern University, David N. Seidman, PI [110] g = [111] 100 nm Centered dark-field transmission electron microscopy (TEM) images of g’-precipitates in Ni-8.5Cr-10Al-2Ru, Ni-8.5C5-10Al-1Ru-1Re and Ni-8.5C5-10Al-.5Ru-.5Re-1W (at.%) after aging at 800oC for 4, 16, 64, or 256 hours (left-side), and comparison of stereologically corrected 3-D precipitate-size distributions (PSDs) with the predictions of the Akaiwa-Voorhees model1 for precipitated volume fractions of 20% (Ru-alloy) or 30% (Ru-Re and Ru-Re-W alloy) 10 nm 1Akaiwa, N. and Voorhees, P.W., Phys. Rev. E 49 (1994) 3860. Dependence of Precipitate Size Evolution at 800°C on Ru, Ru-Re, and Ru-Re-W additions