Advanced Techniques in Calibration and Self-Calibration for VLBI and Spectroscopic Interferometry
This lecture delves into the intricacies of self-calibration and the Maximum Entropy Method (MEM) used in Very Large Baseline Interferometry (VLBI) and spectroscopic interferometry. It explores key concepts such as the calibration of phase and amplitude variations due to environmental factors like the troposphere and ionosphere, as well as measurement techniques of visibility in relation to true visibility. In addition, the lecture references essential literature from Cornwell and discusses constraints and optimization techniques used in reconstruction of astronomical images.

Advanced Techniques in Calibration and Self-Calibration for VLBI and Spectroscopic Interferometry
E N D
Presentation Transcript
Lecture 19 • MEM • Calibration • Self-calibration • VLBI • Spectroscopic interferometry • Finishing with a couple of nice movies.
MEM – the Maximum Entropy Method. • References: (there are many more) • Cornwell T J, chapter 7, NRAO 1985 Synthesis Imaging Summer School. • Cornwell T J & Evans K F, Astron. Astrophys. 143, 77 (1985) • Notation: • Ij are the pixel values of the ‘true’ sky image. • Djrepresent the pixel values of the data (ie the dirty image). • Mj – an image representing a priori information. • Rj are the pixel values of the solution image. • (2-dimensional images are here represented by a single pixel index j just for brevity.)
MEM – the Maximum Entropy Method. Data Dj Prior information Mj Solution Rj ? ? …We need ways to measure the ‘distance’ between these various images.
MEM – the Maximum Entropy Method. Data Dj Prior information Mj Solution Rj ? Chi squared: …but this is not really valid because the adjacent pixels of the dirty image are not independent. We would need to include covariances σjk.
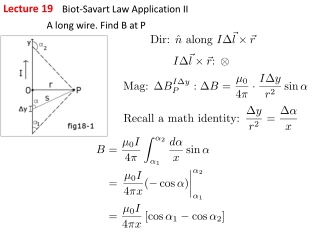
MEM – the Maximum Entropy Method. Data Dj Prior information Mj Solution Rj ? Chi squared: Better: where Vk are the measured visibilities and
MEM – the Maximum Entropy Method. Data Dj Prior information Mj Solution Rj Chi squared: ‘Entropy’: (Other choices are possible.)
MEM – the Maximum Entropy Method. Data Dj Prior information Mj Solution Rj Chi squared: ‘Entropy’: (Other choices are possible.) • The actual algorithm employed in interferometry maximizes H subject to the constraint that χ2 equals the expected value. • Constrained optimization can be done via the technique of Lagrange Multipliers (too advanced for this course). • Additional constraints (eg on the total image flux ΣRj) can easily be added.
MEM – the Maximum Entropy Method. • Choice of M? • Usually flat. • M can be adjusted during the procedure • as can other parameters. • MEM performs well on extended sources • complements CLEAN which is better for compact sources.
Calibration • So far we have been assuming that geometry is the only source of phase differences. • But phase (and amplitude) may also vary because of • Imperfections and/or instabilities in the electronics; • Changes in gain originating in properties of the primary beam; • Changes in refraction and path length through • the atmosphere (troposphere); • the ionosphere. • All these need to be calibrated out. Most important for an observer.
Calibration - the troposphere • Phase delay due to troposphere varies with zenith angle α (approx as 1/cos α). • Although for α -> 90°, curvature of the earth stops this going to infinity.
Calibration - the troposphere • Components: • ‘Dry air’ component: • Varies slowly. • Range in variation is small. • Directly measurable (via pressure). • ‘Wet’ component (ie, water vapour): • Can vary quickly. • Can vary over a large range. • Unpredictable... • although H2O radiometers can help. • Typical addition to ‘optical path length’ is over 2 metres.
Calibration - the ionosphere • Variation with zenith angle is very similar to that for the troposphere.
Calibration - the ionosphere • Excess path length varies with frequency as • where Ne is the electron column density in m-2. Note that ΔL is negative because the refractive index is negative (yes it is weird). • A typical value is about 1 m. • Varies by a factor of 5 between day and night; • Also large variation during ‘solar storms’. • The variation with ν means one can calculate it by simultaneous measurements at different frequencies.
Calibration • Methods of calibration include: • Internal monitoring of antenna parameters (eg pointing, gain), and corrections calculated from these. • Infrequent observation (usually by observatory support staff) of calibration sources to calibrate a host of antenna parameters which vary only slowly with time. • Once-per-observing-session observation of a ‘primary flux calibrator’. • Frequent during-observation peeks at a ‘phase calibrator’. • The last two are the most important for an observer to know about.
Calibration – some maths. • A measurement of visibility V~j,k between antennas j and k is related to the ‘true’ visibility Vj,k by • where Gj,k is the complex gain, εj,k is an offset and ηj,k is noise. • Gj,k can be resolved into a product gjg*k of complex-valued antenna gainsgj and gk, which depend purely on the antennas j and k respectively, times a so-called ‘closure error’ gj,k. (Note: all these are complex numbers.)
Calibration – some maths. • Since the correlation is a digital operation, and thus not subject to analog-type errors, most errors occur upstream of the correlation, and are therefore antenna-specific. • Hence, the closure error gj,k is usually close to 1+i0, and can be ignored, at least at a first pass.. • Similarly, the offset εj,k is usually small and ignorable. • Noise ηj,k can be minimized through integration over time.
Calibration – some maths. • Thus we can write, to first order approximation, • where aj and ak are (real-valued) amplitude errors and φj-φk is the (real-valued) phase-difference error. • Note that both as and φs vary with time in an unpredictable fashion. (φ much more than a.) • Most of this variation is due to random changes in the atmosphere + ionosphere.
Calibration – some maths. • Note that there are only 2N quantities to calculate (1 a and 1 φ per antenna) but we have N(N-1) ~ N2 measurements (a real and an imaginary value from each of N(N-1)/2 correlations). This is a happy situation whenever N>4 (as it is for all modern arrays of any importance). • This means that we don’t need measurements of V~ from all baselines – which turns out to be useful for reasons shortly to be revealed.
The ideal calibrator • Position and structure: • point-like; • not confused; • of exactly known position; • near the object of interest. • Flux: • strong; • doesn’t vary with time; • smooth, flat spectrum. • Different situations impose differing relative emphasis.
The real calibrator • Of course (just like with people) we have to make do with calibrators which never meet all these desirables at once, and sometimes don’t meet any of them! • Some trade-offs: • To find a calibrator near our object, we might have to accept one which is not as strong as we’d like (n ~ S-5/2 rule). • A compact calibrator is usually time-variable, sometimes on timescales as short as a day. • We may have to discard data from short baselines (because the calibrators are confused) and also from long ones (because they resolve the calibrator).
‘Goldilocks’ baselines What short baselines see: confused. What long baselines see: resolved. What just-right BL see: isolated points.
A simulated observation – V(t) from 1 baseline: Amplitudes shown here. Telescopes are moving between the target (long cycle) and the calibrator (short cycle).
A simulated observation – V(t) from 1 baseline: Phases shown here – all cycles. Telescopes are moving between the target (long cycle) and the calibrator (short cycle).
A simulated observation – V(t) from 1 baseline: Phases shown here cal cycles only. Telescopes are moving between the target (long cycle) and the calibrator (short cycle).
Special calibrations: • Spectral-line: • requires band-pass calibration. • Polarization: • ‘leakage terms’; • Most modern feeds have 2 detectors, of opposite polarisation; • but their mutual isolation is not perfect. • variation in polarization across the beam; • A kind of polarized spherical aberration. • ionospheric Faraday rotation.
Self-calibration • Ordinary calibration using an offset source relies on: • interpolation between peeks at the cal; • the assumption that the phase shift in the direction of the cal is the same as towards the target. • Variations due to imperfection of these assumptions is usually >> thermal noise. • Effect of this depends on size of array: • Small array: may degrade image a little. • VLBI: completely impossible to calibrate this way! • So - can we do better...?
Self-calibration • Suppose we knew I(l,m), the brightness distribution of the target. • Fourier transform this to get a continuous model visibility function V^(u,v). • Divide the measured visibility samples V~j,k(u,v,t) for baseline j-k by this model V^. • Is not the result the V we’d get from a point source, multiplied by the product of the antenna ‘gains’ gjg*k (slide 8)? • Then just perform normal calibration of gj and gk.
Bootstrap • But... I is what we are trying to find out! • However – an iterative approach works well, provided: • the target is fairly bright; • a starting model can be obtained. • A quite separate approach utilizes redundant spacings – 2 or more visibility samples which lie very close to each other in the u-v plane. • Westerbork was specifically designed to facilitate this – lots of antennas are the same distance apart.
Very Long Baseline Interferometry (VLBI) • Maths is the same as standard interferometry – it is the practical details which tend to be different. • Antennas are thousands rather than tens of km apart. Hence: • Resolution can be 1 milliarcsecond (mas) or even lower. • It isn’t practical to lock all antennas to the same frequency standard (LO). Each has its own... • thus the LOs must be very stable (eg H maser). - $$$ • Data are stored on tape and correlated later. • With the longer baselines, the array is proportionately more sensitive to phase errors... • so special calibration techniques are needed.
VLBI – a typical image: CSO 1943+546 Polatidis et al NewAR 43, 657 (1999) Courtesy the EVN archive.
Spectroscopy • What physical environment is associated with spectral lines? • Isolated atoms (may be partially ionized). • Spectral lines can be observed both in emission and absorption. • Information coming out of spectroscopic interferometry: • composition, column densities, temperature, velocity (both ‘bulk’ or nett, and velocity dispersion). • Processing: • each channel imaged and CLEANed separately.
Spectroscopy • We are now measuring not just x and y but also a 3rd axis, ν. Hence we deal not in images but in data cubes. • A challenge to handle • Can be huge: 20482 x 1024 pixels = 16 GB • A challenge to visualize • Channel maps and movies • Moment maps: intensity, velocity, width • 3D rendering and visualization software… • A challenge to analyse… • Model for structure & kinematics • Optical depth effects • Excitation: collisions vs radiation
M82 cube movie Shows HI absorption – different velocities (therefore different Doppler-shifted frequency) at different places. Many thanks to Rob Beswick. Continuum plus line M82 HI (Wills, Pedlar et al)
HI imaging • Valuable for cosmology: • Traces galaxies large-scale structure. • Also shows kinematics inside galaxies. • But, it’s hard to get high resolution... • because the brightness temperature of HI is limited to about 100 K; • bandwidth is limited; • wavelength is relatively long; • and, for an interferometer, Ae is notλ2/ΩA, as is true for a single dish. Ae stays fixed (it’s a property of the antennas). • Thus smaller beam (ie ΩA) gets less flux. For HI, practical limit to ΩA (and thus resolution) is ~1 arcsec.
Another M82 movie, showing OH emission and absorption, with continuum subtracted. Note ringing about the brightest 1667MHz maser. Many thanks to Rob Beswick. M82 OH – 1665 & 1667 lines – masers & absorption VLA A-array data (Argo et al 2007) Two lines in band Absorption in black Masers in blue