Download
1 / 33
330 likes | 476 Vues
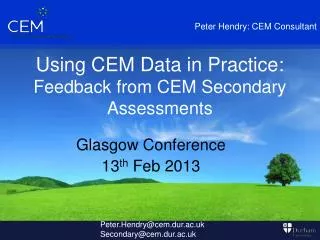
A View from Highland on the use of CEM Data. Peter Finlayson Quality improvement Officer February 2013. Ideas to take away from today. Why Highland are using CEM data. How CEM data might help inform the Transition process Some knowledge of pupil feedback information from SOSCA

E N D
A View from Highland on the use of CEM Data Peter Finlayson Quality improvement Officer February 2013
Ideas to take away from today Why Highland are using CEM data • How CEM data might help inform the Transition process • Some knowledge of pupil feedback information from SOSCA • Pupil Tracking-how SOSCA helps • Where CEM Data might fit in a school’s self evaluation • Where added value can be identified • Self Evaluation for the Authority
Highland Background • 29 Secondary schools • 183 Primary Schools • All Primary schools use InCAS in P3,P5 and P7 • All secondary schools use SOSCA in S2 • A few use MidYIS in S1 • Financial Commitment!!
Why are Highland using Standardised Testing(CEM)? • Improve outcomes for Young People • Teachers still developing Assessment Standards • Qualifications will still be a major part of a pupil’s portfolio of achievement • Qualifications will be norm referenced • CEM Background
Broad General EducationandSenior Phase • How do we know how well pupils are progressing • Are they achieving their potential? Key Questions
About Assessment for Excellence (AfE) · AfE is a suite of assessments that provides information about pupils' attainment and attitudes, complementing teachers' assessments of pupils' progress through CfE. · CEM's AfE tests and feedback software enable a personalised approach to assessment in a format that pupils can relate to. · AfE can ease assessment processes and aims to provide a stable and long-term approach to school evaluation. · CEM assesses more than one million pupils every year and has a wealth of experience in providing accurate, reliable information. This information can help inform teaching and management decisions and can really make a difference to the outcomes of the child. · CEM's AfE produces data which is nationally representative and have year-on-year comparisons so teachers can compare students' performance against established norms.
Key Principles "It comes down to the quality of what happens in the classroom, putting children at the centre. If we know a child can attain better, how can we help? We need to become interventionists.“ Head of Education for Fife, Craig Munro "The big question for many people is, 'How do we translate this data into improving learning?' We (CEM) offer research-based advice on how to help children succeed in the classroom and we give detailed feedback which the teacher can use alongside their detailed professional knowledge of each pupil.“ Director of Research and Development for CEM, Christine Merrell "We don't want assessments that don't support learning. We want to promote improvements in learning, teaching and schools' performance.“ Ken Greer, Executive Director of Education for Fife Council The information provided through CEM assessments can helpteachers monitor pupils' progress, set targets, facilitate school improvement and inform the teaching and learning process.
Information from Primary Schools • All primary schools in Highland use InCAS • All Primary schools use the Highland SPP Approach • Professional Judgement backed up by InCAS data • 5-14 on its own was flawed!! • All Secondary schools receive the AfE data from Primary as Standardised Scores through Phoenix e1
The Personal Progress Scale 1 – is consistently achieving his/her potential 2 – is consistently achieving success buthas the potential to achieve more 3 – is only sometimes achieving potential 4 – is yet to achieve potential
The Performance Scale A - is consistently performing beyond the expected standard for his/her stage B - is consistently performing at the expected standard for his/her stage C - is sometimes performing at the expected standard for his/her stage D - is not yet performing at the expected standard for his/her stage
SOSCA Feedback • Assessed by a computer adaptive test • School and students’ test performances are compared • to a nationally representative sample
AfE S2 Curriculum (SOSCA) Feedback • Assessment Feedback: • Pupil scores and records, and school Band Profiles • ‘Predictions’ Feedback: • To S4 qualifications (currently Standard Grade and will for National 4 and 5) based on overall curriculum score • Value-Added Feedback: • For Standard Grade and will for National 4 and 5 from curriculum baseline (SOSCA) • for curriculum assessment (SOSCA) from P7 InCAS or S1 /S2 MidYIS baselines
InCAS and SOSCA Data is used to inform teacher judgements around the SPP
SOSCA Predictions • Chances Graphs
Predictions: Chances Graphs 49% chance of a grade 2 – the most likely single grade. 51% chance of a different grade Chances Graphs based on Pupil’s AfE Test Score
‘Predictions’…...are based on Average performance by similar students in past examinations • So the term ‘prediction’ should not be used. Alternatives could include: • ‘expected grade’: from the table of data • ‘most likely grade’: from the chances graphs • Reliability of ‘predictions’? • School factors inc. catchment area • How seriously the pupil took the assessment.
Quotes from Highland Schools “We have used them for target setting in S3.” “We do 'working at grades' twice a year and this year we used SOSCA as a guide to what they should be working at.” “I have used them to compare results and predictions in the department.” “All HOD's have been trained on the use of SOSCA.” “All departments are aware of the information and should know what the information means (!) More time was spent with Guidance, LS, English, Maths and Science going over the data. Guidance staff have all printed the IPRs, they have been placed in the pupil files and refer to them regularly. ” “Learning Support and English make regular use of the information. ”
Personal Support • Important role for the Key Adult? • Tracking of attainment-one aspect • Individual Pupil record from SOSCA? • Course Choice at end of S2? • Course Choice at end of S3?
School Self Evaluation • STACS –comparator schools • SOSCA Tables • Band Profile Graphs • Value Added Data
School A School B
Highland Example • School A and School B • Inspection reports • Attainment Data • SIMD Data
SchoolA 2008 By the end of S2, pupils were making very good progress and attaining well across the Curriculum.. Most pupils were attaining appropriate levels in mathematics, reading and writing. By the end of S4 , the proportion of pupils attaining five or more Awards at SCQF levels 4 and 5 was well above national averages, and in line with schools with similar characteristics. SchoolB 2009 Across the curriculum, young people achieve well in S1/S2 The majority achieve appropriate national standards by the end of S2 In recent years, the success of young people in S4, in national examinations, has generally been in line with the national average. It is stronger than in schools which serve young people with similar needs and backgrounds
SOSCA Information School A