Download
1 / 23
230 likes | 319 Vues
Detailed review of candidate proficiencies, survey data trends, and program performance metrics. Recommendations for improvement included.

E N D
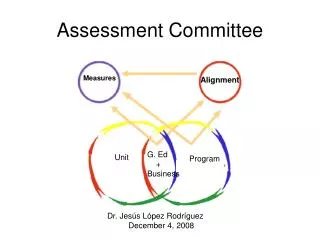
Exhibit 3.11 Data Report to Unit Assessment Committee Spring 2008
AGENDA • UAS Document Update • Review Data Trends and Patterns • Candidate Proficiencies • SPA Data (Marge) and Survey Data • Ratings (Marge) • Open-ended comments (Molly) • Trends in SPA Recognition Reports (Molly) • Unit Operations • Survey Data • Ratings (Marge) • Open-ended comments (Molly) • AACTE Professional Data Systems (PEDS) (Molly) • Title II (Marge) • US News and World Report (Marge) • Discussion and Recommendations (Marge and UAC)
UAS DOCUMENT • Candidate Proficiencies – Table 1 • Internal - Focal Assessments • Table 2 - Internal – Surveys • Unit Operations – Table 2 • Internal • External • Table 3 – to be completed by UAC subcommittee for Fall 2008
FA Data Trends - Content • Candidate Proficiencies • MTEL Pass Rates – Table 1.3 • Consistent within the 95% - 100% range over time. • Additional Content Knowledge – Table 1.4 • Overall FA #2 data • Most teaching candidates – • proficiency at target or acceptable levels • Aavanced teacher education candidates, a • average cumulative undergraduate GPAs clustered around 3.28 level for candidates accepted into M.Ed and 3.49 for CAGS programs. • 99% of advanced candidates earned grades in the range of 3.0-4.0 which is the equivalent of acceptable and target. • Thus, the majority of advanced candidates either meet or exceed standard.
Survey Data Trends – Content • Tables 1.5, 1.6, 1.7 • 79% (F07) candidates report being very well or well prepared • 81% (F07) supervising practitioners report high ratings in preparation • 61% (F07) alumni themselves as having been very well or well prepared • Combined with the SPA data, • the unit’s candidates meet or exceed subject matter standards
FA Data Trends – PCK • FA #3 and FA#4 – Table 1.8 • Majority of programs report • candidates scoring at the Target level on FA#3 demonstrating that candidates have knowledge of instructional strategies that draw upon content. • FA#3 coupled with FA#4 (also high percentages of candidates at the Target level) • demonstrates that candidates have PCK and skills that help all students learn. • Advanced candidates grades in the coursework designated for field experiences 99% of candidates earned grades in the range of 3.0-4.0 which is the equivalent of acceptable and target. • The majority of candidates meet or exceed standard
Survey Data Trends – PCK • Table 1.9 • Candidates believe they are very well or well prepared in the utilization of a broad range of content related instructional strategies and meet standards for PCK (F07=63% & 78%) • (F07=70% & 74%) of supervising practitioners rated candidates very well or well prepared in PCK • Alumni respondents rated themselves as very well or well prepared in PCK (F07=61% & 53%) • There is a trend of improvement in respondents’ assessments of quality in pedagogical content knowledge preparation over time. • Overall, the survey results support the FA#3 and FA#4 results.
FA and Survey Data Trends – Technology • FA - Candidates cannot be recommended for licensure without receiving acceptable or target ratings on technology related standards - 100% meet technology requirements • Table 1.10 – Surveys show a trend of increased preparation over time. • In 2002, only 35% of candidates reported themselves as very well/well prepared in the use of technology in teaching. By 2007, that increased to 57% of candidates. • The percentage of supervising practitioners who are in a position to observe candidate use of technology during practicum has also increased from 52% in 2002 to 63% in Fall 2007. • Forty-six percent of 2007 alumni compared to 28% of 2002 alumni also indicated a trend of improvement in the preparation to use technology in teaching.
FA and Survey Data Trends - PPKS • Table 1.11 • 100% of candidates score at acceptable or target levels on PPA (required for licensure recommendation), however, scores are lower in classroom climate and operation standards • Table 1.12 and 1.13 • Survey data from supervising practitioners, candidates and alumni provide confirming evidence that candidates gain competency in the professional and pedagogical knowledge and skills expected by the unit. • Means for PPKS stay in the 3.5 – 4.5 range for most items. • Consistently lower mean ratings occur across groups, across time on the item related to candidate’s abilities to deal effectively with classroom management and student behavior • Paired with data the PPA data above, it is clear that there is room for growth in the area of classroom management.
FA Data Trends - Dispositions • Tables 1.8 & 1.11 • 99% to 100% of candidates meet or exceed dispositions standards. Ed Admin (71%) and School Psychology (100%) • Unit-wide dispositions inventory in pilot round
Survey Data Trends - Dispositions • Table 1.14 • Survey data support FA information. • Candidate and alumni data on disposition related items are similar and both groups rate their preparation lower than supervising practitioners rate it. • Candidates (F07=57%, 88% & 55%) • Alumni (F07=56%, 73% % 49%) • Supervising Practitioners (F07=72%, 93%, 65%) • The lowest ratings across all groups over time relate to the item “interacting positively with students’ families”. • This item aligns to MA Standards for Teachers E.5, Conceptual Framework.5 and INTASC.2, 3, and 8. • 57% of Candidates and 56% of alumni report having been prepared in sensitivity to and preparation for integrating linguistic and cultural diversity into the curriculum. • 72% of supervising practitioners see candidates as well or very well prepared in this area
FA and Survey Data Trends – Student Learning • Table 1.15 • The majority of the unit’s candidates meet the standards at either the target or acceptable levels. • Table 1.16 • Survey data match FA data. Majority of all groups rate preparation as well or very well in terms of assessment and facilitation of student learning • Candidates (F07=70%,65%,& 80%) • Supervising Practitioners (60%, 77%, & 91%) • Alumni (F07=63%, 63%, & 68%) • Means over the past three years are rather consistent in this area, although the general trend is that ratings are improving each year. • Table 1.17 • Advanced candidates’ grades in the range of 3.0-4.0 which is the equivalent of acceptable and target. • Table 1.18 OSP meets or exceeds standards • Table 1.18 – OSP meets or exceeds standards
Summary of Survey Open-Ended Comments Candidate Proficiencies Useful Aspects of Educator Licensure Program • People: Students/cohort, faculty, university supervisors, supervising practitioners • Other factors: courses, assessments, duration of practicum. Use of Technology in Instruction
SPA Recognition Reports – Trends Basic Stats
So What? • Many strengths across programs • Consistently weak items across programs • classroom management and dealing with student behavior • Interacting positively with students’ families • Alumni ratings in all categories are lower than the other two groups • What else? • Break!!!!!!!!!!!!!!!
Unit Operations – Survey Data • Advising – Candidates and Alumni • Means up and down over years • Dissatisfied with support in seeking employment • Practicum • General satisfaction overall • Dissatisfied somewhat with pre-practicum arrangements • Supervising Practitioners • Overall general satisfaction with arrangements, communication, meetings, evaluation • Continually somewhat dissatisfied with incentives/rewards received
Unit Operations – Survey Data Unit Operations • Positive: Faculty, supervising practitioner, program administration, practicum, program length. • Negative: Program administration, program information, advising, communication with faculty and administration.
Unit Operations Surveys • Dissatisfied with support in seeking employment • Dissatisfied somewhat with pre-practicum arrangements • Continually somewhat dissatisfied with incentives/rewards received (Sup Prac)
AACTE PEDS Trends Institutional Undergraduate and Graduate Enrollment – on the rise between 2003 and 2006. • Undergraduate students in Ed. Program: 0.22% of total institutional undergraduate enrollment. • Graduate students in Ed. Program: 16.8% of total institutional graduate enrollment (average). • Graduate students in Non Ed. Program: 0.44% of total institutional graduate enrollment (average).
AACTE PEDS Trends Professional Education Faculty
More External Data • Title II • Numbers of takers and passers somewhat consistent – above the 80% cut off • US News and World Report • Tied for 45th with 10 other universities (we moved up!)
Discussion and Recommendations • What needs to be done about the lower ratings on some items? • Classroom management • Working with families • Support for employment • Prepracticum arrangements • Incentives for supervising practitioners • Others? • How shall we handle the lower alumni ratings across items? • What else? • What next?