Understanding Quality of Life through Human Needs and Well-being Perception
Explore the essential components of quality of life - human needs, opportunities, and subjective well-being - as intertwined concepts. Learn how these factors impact individual satisfaction and overall societal progress.

Understanding Quality of Life through Human Needs and Well-being Perception
E N D
Presentation Transcript
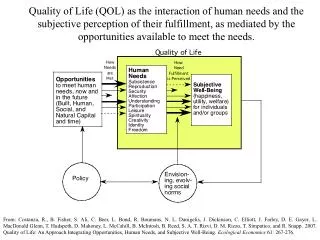
Quality of Life (QOL) as the interaction of human needs and the subjective perception of their fulfillment, as mediated by the opportunities available to meet the needs. From: Costanza, R., B. Fisher, S. Ali, C. Beer, L. Bond, R. Boumans, N. L. Danigelis, J. Dickinson, C. Elliott, J. Farley, D. E. Gayer, L. MacDonald Glenn, T. Hudspeth, D. Mahoney, L. McCahill, B. McIntosh, B. Reed, S. A. T. Rizvi, D. M. Rizzo, T. Simpatico, and R. Snapp. 2007. Quality of Life: An Approach Integrating Opportunities, Human Needs, and Subjective Well-Being. Ecological Economics61: 267-276.
Well-being vs. GDP Contraction and Convergence
From: Costanza, R., S. Farber, B. Castaneda and M. Grasso. 2001. Green national accounting: goals and methods. Pp. 262-282 in: Cleveland, C. J., D. I. Stern and R. Costanza (eds.) The economics of nature and the nature of economics. Edward Elgar Publishing, Cheltenham, England
Genuine Progress Indicator (or ISEW) by Column Additions Built Capital Human Capital Social Capital Natural Capital Subtractions
G. W. Bush G. H. W. Bush Clinton Reagan Carter Ford Nixon Johnson Kennedy Eisenhower Truman Gross Production vs. Genuine Progress for the US, 1950 to 2002 (source: Redefining Progress - http://www.rprogress.org)
Genuine Progress Indicator (GPI) per capita From:Costanza, R. J. Erickson, K. Fligger, A. Adams, C. Adams, B. Altschuler, S. Balter, B. Fisher, J. Hike, J. Kelly, T. Kerr, M. McCauley, K. Montone, M. Rauch, K. Schmiedeskamp, D. Saxton, L. Sparacino, W. Tusinski, and L. Williams. 2004. Estimates of the Genuine Progress Indicator (GPI) for Vermont, Chittenden County, and Burlington, from 1950 to 2000. Ecological Economics 51: 139-155
Ecosystem Services: the benefits humans derive from ecosystems
NATURE |VOL 387 | 15 MAY 1997 253 The value of the world’s ecosystem services and natural capital Robert Costanza, Ralph d’Arge, Rudolf de Groot, Stephen Farber, Monica Grasso, Bruce Hannon, Karin Limburg, Shahid Naeem, Robert V. O’Neill, Jose Paruelo, Robert G. Raskin, Paul Sutton& Marjan van den Belt *. . . . . . . . . . . . . . . . . . . . . . . . . . . . . . . . . . . . . . . . . . . . . . . . . . . . . . . . . . . . . . . . . . . . . . . . . . . . . . . . . . . . . . . . . . . . . . . . . . . . . . . . . . . . . . . . . . . . . . . . . . . . . . . . . . . . . . . . . . . . . . . . . . . . . . . . . . . . . . . . . . . . . . . . . . . . . . . . . . . . . . . . . . . . . . . . . . . . . . . . . . . . . . . . . . . . . . . . . . . . . . . . . . . . . . . . . . . . . . . . . . . . . . . . The services of ecological systems and the natural capital stocks that produce them are critical to the functioning of the Earth’s life-support system. They contribute to human welfare, both directly and indirectly, and therefore represent part of the total economic value of the planet. We have estimated the current economic value of 17 ecosystem services for 16 biomes, based on published studies and a few original calculations. For the entire biosphere, the value (most of which is outside the market) is estimated to be in the range of US$16–54 trillion (1012) per year, with an average of US$33trillion per year. Because of the nature of the uncertainties, this must be considered a minimum estimate. Global gross national product total is around US$18 trillion per year. 2nd most cited article in the last 15 years in the Ecology/Environment area according to the ISI Web of Science.
From: R. Putnam, Bowling Alone: The Collapse and Revival of American Community NewYork: Simon and Schuster, 2000).
http://www.gnhc.gov.bt/ Valuing Nature: Accounting for the Value of Natural Capital and Ecosystem Services GNH Accounts Workshop, March 29-30, 2011 Thimphu, Bhutan