Download
1 / 21
210 likes | 329 Vues
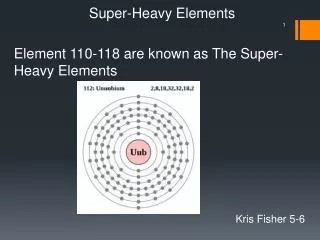
Surface contours and shapes of Super Heavy Elements (SHE) S.Niranjani Department of Information Technology, MOHAMED SATHAK A.J. COLLEGE OF ENGINEERING, Egatur, Chennai – 603 103, India. S.Sudhakar and G.Shanmugam SK INSTITUTE OF HIGHER STUDIES,

E N D
Surface contours and shapes of Super Heavy Elements (SHE) S.Niranjani Department of Information Technology, MOHAMED SATHAK A.J. COLLEGE OF ENGINEERING, Egatur, Chennai – 603 103, India. S.Sudhakar and G.Shanmugam SK INSTITUTE OF HIGHER STUDIES, S-2, Lotus colony, Nandanam, Chennai – 600 035, India www.skhigherstudies.com www.skhigherstudies.org
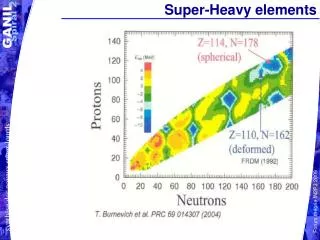
Introduction • A superheavy nucleus is one which is doublymagic beyond Pb (Z=82, N=126) and has a spherical shape, according to theoretical predictions. • While the predicted magic number for proton beyond 82 is 114, 120, 124 or 126 according to non-self-consistent, self-consistent and relativistic theories, the neutron magic number after 126 is to be 172 or 184 according to those theories. • It is generally conjectured that while the macroscopic- microscopic method may give the neutron magic number as N=184 correctly, it predicts the proton magic number beyond Pb only as Z=114 which turns out to be questionable. • We like to show in this work by surface contours that the sphericaldoubly magic nucleus after Pb is 310126184 and not 298114184.
Surface contour • A contour plot is a two-dimensional version of a three-dimensional surface plot. • Given a function v=f ( x, y), a surface contour consists of all the curves that connect all the (x, y) points for a constant v. • In this work, we use Origin software to generate the contour plots given the values x, y and f(x,y).
Sample contour images Simple Contour lines. The number of contour lines, and the color map, and the format of the table can be modified. Some packages will allow you to smooth the sharp edges of the contour lines. Contour lines are good for black and white figures. The individual contours can be labeled. (Software: Tecplot). Taken from Website under Reference
Shaded Contours. Again, the number of contour lines, and the color map, and the format of the table can be modified. Some packages will blend the colors from one level to the next. No such blending occurs in the following image. Shaded contours work well with grayscale. For better results, set the color map to a grayscale while creating the image, rather than converting the color image to grayscale (either by just printing it out on a gray scale printer or by using various image manipulation tools). (Software: Tecplot). Taken from Website under Reference
Contour Lines Displayed on a Surface. The surface can be rotated to view it from different angles. (Software: Tecplot). Taken from Website under Reference
The Surface Colored by the Contour Values. The surface can be rotated to view it from different angles. Note: the colors from one level to the next are blended. (Software: IBM Data Visualization Explorer). Taken from Website under Reference
The Mesh Colored by the Contour Values. Sometimes, viewing the mesh that has been colored by contour values works quite well. The mesh allows you to see through the surface and view all the data. (Software: IBM Data Visualization Explorer). Taken from Website under Reference
Some packages have the ability to smooth out the sharp corners of contour lines. Instead of just drawing lines, such software pieces together smooth curves called splines. In the following image, the contours on the left are the basic contours, the contours on the right use splines. (Software: PV~Wave). Taken from Website under Reference
Advantages • Easy detection of areas of rapid change and areas of constant value. • Well suited to monochrome and gray scale reproduction. • Easy to annotate within the field. • Widely used and generally understood by others. • Can easily be transformed and projected
Synthesis of Super Heavy Elements Recently, at Dubna, two super heavy isotopes 115X288 and 115X287 have been detected together with their expected alpha decay chains followed by spontaneous fission events [1].
Details of calculations • Our macroscopic-microscopic method essentially has two components for the evaluation of the potential energy of nuclei: • A smooth macroscopic liquid-drop model energy part (ELDM). • A fluctuating microscopic part consisting of shell and pairing corrections (Eshell and Epair). • Thus the total energy E is given by, • E(Z,N,ε,)=ELDM(Z,N,ε,) + Eshell(Z,N,ε,) + Epair(Z,N,ε,) • ε and being the elongational and the non-axial • parameters.
Q values of alpha decay of some very heavy and super heavy nuclei
Results using contour plots The results of our calculations are given in the form of Potential Energy Surfaces (normalized to spherical-liquid-drop energy) in the (Q20, Q22) plane, where Q20 = Q0cos and Q22=Q0/√2sin [3].
Figure 1: Potential Energy Surface (normalized to spherical-liquid-drop energy in MeV) for 82Pb208
Figure 2: Potential Energy Surface (normalized to spherical-liquid-drop energy in MeV) for 114X286
Figure 3: Potential Energy Surface (normalized to spherical-liquid-drop energy in MeV) for 124X300
Figure 4: Potential Energy Surface (normalized to spherical-liquid-drop energy in MeV) for 126X310
References: [1] G.Shanmugam, S.Sudhakar and S.Niranjani Phys.Rev.C 72, 034310(2005) and references therein. [2] G.Shanmugam, S.Sudhakar, S.Niranjani and D.K.Mohapatra, submitted to Phys. Rev.C (2005). [3] S.Cwiok, P.H.Heenen and W.Nazarewicz, Nature 433, 705 (2005). Websites: http://www.msi.umn.edu/user_support/scivis/techniques/contours.html