Download
1 / 77
770 likes | 789 Vues
Explore the advancements in data analysis using Support Vector Machines and Distance Weighted Discrimination, focusing on HDLSS simulations across known phenomena like Spherical Gaussians, outliers, and polynomial embedding. Compare linear methods in a non-linear way across various dimensions and sample sizes. Caution: easily cherry-picking best results in simulations. Dive into HDLSS asymptotics, paradoxes, and geometrical representations, uncovering the unexpected rigidity in high-dimensional data structures. Study the convergence of methods in higher dimensions and caution against overlooking proposed methods.

E N D
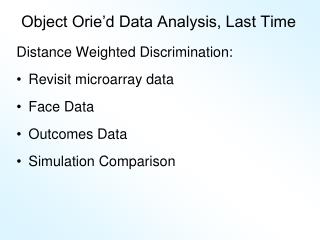
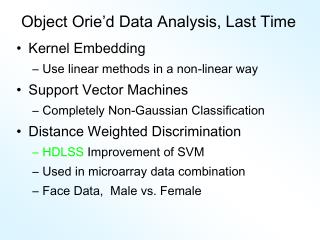
Object Orie’d Data Analysis, Last Time • Kernel Embedding • Use linear methods in a non-linear way • Support Vector Machines • Completely Non-Gaussian Classification • Distance Weighted Discrimination • HDLSS Improvement of SVM • Used in microarray data combination • Face Data, Male vs. Female
Support Vector Machines Forgotten last time, Important Extension: Multi-Class SVMs Hsu & Lin (2002) Lee, Lin, & Wahba (2002) • Defined for “implicit” version • “Direction Based” variation???
Distance Weighted Discrim’n 2=d Visualization: Pushes Plane Away From Data All Points Have Some Influence
Distance Weighted Discrim’n Maximal Data Piling
HDLSS Discrim’n Simulations Main idea: Comparison of • SVM (Support Vector Machine) • DWD (Distance Weighted Discrimination) • MD (Mean Difference, a.k.a. Centroid) Linear versions, across dimensions
HDLSS Discrim’n Simulations Overall Approach: • Study different known phenomena • Spherical Gaussians • Outliers • Polynomial Embedding • Common Sample Sizes • But wide range of dimensions
HDLSS Discrim’n Simulations Spherical Gaussians:
HDLSS Discrim’n Simulations Spherical Gaussians: • Same setup as before • Means shifted in dim 1 only, • All methods pretty good • Harder problem for higher dimension • SVM noticeably worse • MD best (Likelihood method) • DWD very close to MS • Methods converge for higher dimension??
HDLSS Discrim’n Simulations Outlier Mixture:
HDLSS Discrim’n Simulations Outlier Mixture: 80% dim. 1 , other dims 0 20% dim. 1 ±100, dim. 2 ±500, others 0 • MD is a disaster, driven by outliers • SVM & DWD are both very robust • SVM is best • DWD very close to SVM (insig’t difference) • Methods converge for higher dimension?? Ignore RLR (a mistake)
HDLSS Discrim’n Simulations Wobble Mixture:
HDLSS Discrim’n Simulations Wobble Mixture: 80% dim. 1 , other dims 0 20% dim. 1 ±0.1, rand dim ±100, others 0 • MD still very bad, driven by outliers • SVM & DWD are both very robust • SVM loses (affected by margin push) • DWD slightly better (by w’ted influence) • Methods converge for higher dimension?? Ignore RLR (a mistake)
HDLSS Discrim’n Simulations Nested Spheres:
HDLSS Discrim’n Simulations Nested Spheres: 1st d/2 dim’s, Gaussian with var 1 or C 2nd d/2 dim’s, the squares of the 1st dim’s (as for 2nd degree polynomial embedding) • Each method best somewhere • MD best in highest d (data non-Gaussian) • Methods not comparable (realistic) • Methods converge for higher dimension?? • HDLSS space is a strange place Ignore RLR (a mistake)
HDLSS Discrim’n Simulations Conclusions: • Everything (sensible) is best sometimes • DWD often very near best • MD weak beyond Gaussian Caution about simulations (and examples): • Very easy to cherry pick best ones • Good practice in Machine Learning • “Ignore method proposed, but read paper for useful comparison of others”
HDLSS Discrim’n Simulations Caution: There are additional players E.g. Regularized Logistic Regression looks also very competitive Interesting Phenomenon: All methods come together in very high dimensions???
HDLSS Asymptotics: Simple Paradoxes, I • For dim’al Standard Normal dist’n: • Euclidean Distance to Origin (as ): • - Data lie roughly on surface of sphere of radius • - Yet origin is point of highest density??? • - Paradox resolved by: • density w. r. t. Lebesgue Measure
HDLSS Asymptotics: Simple Paradoxes, II • For dim’al Standard Normal dist’n: • indep. of • Euclidean Dist. between and (as ): • Distance tends to non-random constant: • Can extend to • Where do they all go??? • (we can only perceive 3 dim’ns)
HDLSS Asymptotics: Simple Paradoxes, III • For dim’al Standard Normal dist’n: • indep. of • High dim’al Angles (as ): • - Everything is orthogonal??? • - Where do they all go??? • (again our perceptual limitations) • - Again 1st order structure is non-random
HDLSS Asy’s: Geometrical Representation, I • Assume , let • Study Subspace Generated by Data • Hyperplane through 0, of dimension • Points are “nearly equidistant to 0”, & dist • Within plane, can “rotate towards Unit Simplex” • All Gaussian data sets are“near Unit Simplex Vertices”!!! • “Randomness” appears only in rotation of simplex Hall, Marron & Neeman (2005)
HDLSS Asy’s: Geometrical Representation, II • Assume , let • Study Hyperplane Generated by Data • dimensional hyperplane • Points are pairwise equidistant, dist • Points lie at vertices of “regular hedron” • Again “randomness in data” is only in rotation • Surprisingly rigid structure in data?
HDLSS Asy’s: Geometrical Representation, III • Simulation View: shows “rigidity after rotation”
HDLSS Asy’s: Geometrical Representation, III • Straightforward Generalizations: • non-Gaussian data: only need moments • non-independent: use “mixing conditions” • Mild Eigenvalue condition on Theoretical Cov. • (with J. Ahn, K. Muller & Y. Chi) • All based on simple “Laws of Large Numbers”
HDLSS Asy’s: Geometrical Representation, IV • Explanation of Observed (Simulation) Behavior: • “everything similar for very high d ” • 2 popn’s are 2 simplices (i.e. regular n-hedrons) • All are same distance from the other class • i.e. everything is a support vector • i.e. all sensible directions show “data piling” • so “sensible methods are all nearly the same” • Including 1 - NN
HDLSS Asy’s: Geometrical Representation, V • Further Consequences of Geometric Representation • 1. Inefficiency of DWD for uneven sample size • (motivates weighted version, work in progress) • 2. DWD more stable than SVM • (based on deeper limiting distributions) • (reflects intuitive idea feeling sampling variation) • (something like mean vs. median) • 3. 1-NN rule inefficiency is quantified.
The Future of Geometrical Representation? • HDLSS version of “optimality” results? • “Contiguity” approach? Params depend on d? • Rates of Convergence? • Improvements of DWD? • (e.g. other functions of distance than inverse) • It is still early days …
NCI 60 Data • Recall from Sept. 6 & 8 • NCI 60 Cell Lines • Interesting benchmark, since same cells • Data Web available: • http://discover.nci.nih.gov/datasetsNature2000.jsp • Both cDNA and Affymetrix Platforms
NCI 60: Fully Adjusted Data, Melanoma Cluster BREAST.MDAMB435 BREAST.MDN MELAN.MALME3M MELAN.SKMEL2 MELAN.SKMEL5 MELAN.SKMEL28 MELAN.M14 MELAN.UACC62 MELAN.UACC257
NCI 60: Fully Adjusted Data, Leukemia Cluster LEUK.CCRFCEM LEUK.K562 LEUK.MOLT4 LEUK.HL60 LEUK.RPMI8266 LEUK.SR
Real Clusters in NCI 60 Data? • From Sept. 8: Simple Visual Approach: • Randomly relabel data (Cancer Types) • Recompute DWD dir’ns & visualization • Get heuristic impression from this • Some types appeared signif’ly different • Others did not • Deeper Approach: • Formal Hypothesis Testing
HDLSS Hypothesis Testing • Approach: DiProPerm Test • Direction – Projection – Permutation • Ideas: • Find an appropriate Direction vector • Project data into that 1-d subspace • Construct a 1-d test statistic • Analyze significance by Permutation
HDLSS Hypothesis Testing – DiProPerm test • DiProPerm Test • Context: • Given 2 sub-populations, X & Y • Are they from the same distribution? • Or significantly different? • H0: LX = LY vs. H1: LX≠LY
HDLSS Hypothesis Testing – DiProPerm test • Reasonable Direction vectors: • Mean Difference • SVM • Maximal Data Piling • DWD (used in the following) • Any good discrimination direction…
HDLSS Hypothesis Testing – DiProPerm test • Reasonable Projected 1-d statistics: • Two sample t-test (used here) • Chi-square test for different variances • Kolmogorov - Smirnov • Any good distributional test…
HDLSS Hypothesis Testing – DiProPerm test • DiProPerm Test Steps: • For original data: • Find Direction vector • Project Data, Compute True Test Statistic • For (many) random relabellings of data: • Find Direction vector • Project Data, Compute Perm’d Test Stat • Compare: • True Stat among population of Perm’d Stat’s • Quantile gives p-value
HDLSS Hypothesis Testing – DiProPerm test • Remarks: • Generally can’t use standard null dist’ns… • e.g. Students t-table, for t-statistic • Because Direction and Projection give nonstandard context • I.e. violate traditional assumptions • E.g. DWD finds separating directions • Giving completely invalid test • This motivates Permutation approach
HDLSS Hypothesis Testing – DiProPerm test • Many Open Questions on DiProPerm Test: • Which Direction is “Best”? • Which 1-d Projected test statistic? • Permutation vs. altern’es (bootstrap?)??? • How do these interact? • What are asymptotic properties?
Independent Component Analysis Idea: Find dir’ns that maximize indepen’ce Motivating Context: Signal Processing Blind Source Separation References: • Cardoso (1989) • Cardoso & Souloumiac (1993) • Lee (1998) • Hyvärinen and Oja (1999) • Hyvärinen, Karhunen and Oja (2001)
Independent Component Analysis ICA, motivating example: Cocktail party problem Hear several simultaneous conversations would like to “separate them” Model for “conversations”: time series: and
Independent Component Analysis Cocktail Party Problem