Understanding Thermal Analysis: Principles, Methods, and Applications
Thermal analysis encompasses various techniques used to investigate the physical and chemical properties of materials as they change with temperature or time. Essential for quality control and research across industries like polymers, pharmaceuticals, and metals, it provides insights into thermal stability, decomposition kinetics, and moisture content. Techniques such as Thermogravimetry (TG) measure weight changes, contributing to a deeper understanding of material behavior. By identifying factors influencing the TG curve, scientists can optimize conditions for desired reactions and improve product performance.

Understanding Thermal Analysis: Principles, Methods, and Applications
E N D
Presentation Transcript
Thermal Analysis Prof. Nizam M. El-Ashgar
Introduction • Thermal Analysis is the term applied to a group of methods and techniques in which chemical or physical properties of a substance, a mixture of substances or a reaction mixture are measured as a function of temperature or time, while the substances are subjected to a controlled temperature programme. • Over a dozen thermal methods can be recognized, which differ in the properties measured and the temperature programs. • Find widespread use for both quality control and research applications on industrial products such as polymers, pharmaceuticals, clays and minerals, metals and alloys.
What TGA Can Tell You • Thermal Stability of Materials. • Oxidative Stability of Materials. • Composition of Multi-component Systems. • Estimated Lifetime of a Product. • Decomposition Kinetics of Materials. • The Effect of Reactive or Corrosive Atmospheres on Materials. • Moisture and Volatiles Content of Materials.
The following table is a list of the main thermal analysis methods:
While carrying out these measurements, the furnace atmosphere can either be static air or a continuous flow of gas (purging). Examples are: inert conditions (nitrogen) to inhibit oxidation, or reducing condition (e.g. purging hydrogen), etc.
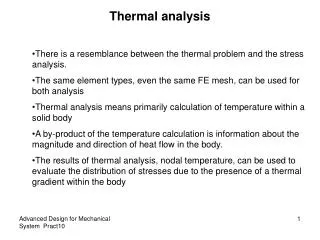
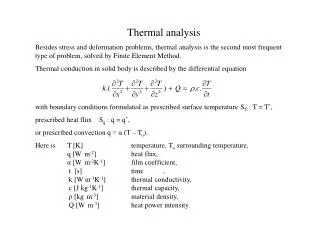
General thermodynamic relationships Thermal analyses are usually run under conditions of constant pressure, the underlying thermodynamic equation is the Gibbs-Helmholtz expression: G0 = H0 - TS0 where G=free energy of the system, H=enthalpy of the system, S=entropy of the system, T=temperature in kelvins The general chemical reaction aA + bB cC + dD Is spontaneous as written if G<0, is a t equilibrium if G=0, and does not proceed if G >0. Thermal analysis involves the monitoring of spontaneous reaction.
Differentiating the Gibbs-Helmholtz equation with respect to temperature (assuming S and H not vary with temperature): Show how to move from a stable situation (G>>0) to one where reaction will occur. S > 0, an increase in temperature cause G<0, S < 0, decreasing the temperature will achieve the desired spontaneous reaction. Once the reaction is made to occur, thermal analysis may be used to detect the process, yielding different and complementary information.
Thermal methods Generalized instrument: • Temperature programmer • Sample in furnace with controlled atmosphere x axis y axis • temperature property • Output: Plot of the property (y axis) versus T.
Types of thermal event • - Phase transition. - Adsorption, desorption. • - Sublimation. - Thermal decomposition. • - Radiolytic decomposition. - Glass transition. • - Oxidation/ combustion. - Heterogeneous catalysis. • Double decomposition. - Desolvation. • Melting (fusion).
Thermogravimetry (TG) • Thermogravimetric analysis (TG): is the study of weight changes of a specimen as a function of temperature or time. The temperature is increased at a constant rate for a known initial weight of the substance and the changes in weights are recorded as a function of temperature at different time interval. • The technique is useful strictly for transformations involving the absorption or evolution of gases from a specimen consisting of a condensed phase. • A plot of mass versus temperature (thermogravimetric curves or thermogram or TG curves) permits evaluation of thermal stabilities, rate of reaction, reaction processes, and sample composition. • Measurements of changes in sample mass with temperature are made using thermobalance. The balance should be in a suitably enclosed system so that the atmosphere can be controlled.
General considerations Suitable samples for TG are solids that undergo one of the two general types of reaction: Reactant(s) Product(s) + Gas (a mass loss) Gas + Reactant(s) Product(s) (a mass gain) Processes occurring without change in mass (e.g., the melting of a sample) obviously cannot be studied by TG.
Mechanisms of Weight Change in TGA • Weight Loss: • Decomposition: The breaking apart of chemical bonds. • Evaporation: The loss of volatiles with elevated temperature. • Reduction: Interaction of sample to a reducing atmosphere (hydrogen, ammonia, etc). • Desorption: a substance is released from a surface. • Weight Gain: • Oxidation: Interaction of the sample with an oxidizing atmosphere. • Absorption: absorbing something or of being absorbed. All of these are kinetic processes (i.e. there is a rate at which they occur).
Factors affecting the TG curve The factors which may affect the TG curves are classified into two main groups. (1) Instrumental factors (2) Sample Characteristics (1) Instrumental factors (a) Furnace heating rate (b) Furnace atmosphere (2) Sample characteristics includes (a) Weight of the sample (b) Sample particle size
Instrumental factors • Furnace Heating rate: The temperature at which the compound (or sample) decompose depends upon the heating rate. When the heating rate is high, the decomposition temperature is also high. A heating rate of 3.5°C per minute is usually recommended for reliable and reproducible TGA. • Furnace atmosphere: The atmosphere inside the furnace surrounding the sample has a profound effect on the decomposition temperature of the sample. A pure N2 gas from a cylinder passed through the furnace which provides an inert atmosphere.
Sample characteristics (a)Weight of the sample: A small weight of the sample is recommended using a small weight eliminates the existence of temperature gradient throught the sample. (b) Particle size of the sample: The particle size of the sample should be small and uniform. The use of large particle or crystal may result in apparent, very rapid weight loss during heating
Applications of TGA • From TGA, we can determine the purity and thermal stability of both primary and secondary standard. • Determination of the composition of complex mixture and decomposition of complex. • For studying the sublimation behaviour of various substances. • TGA is used to study the kinetics of the reaction rate constant. • Used in the study of catalyst: The change in the chemical states of the catalyst may be studied by TGA techniques. (Zn-ZnCrO4) Zinc-Zinc chromate is used as the catalyst in the synthesis of methanol.
Optimum conditions i) Few mg sample. ii) Thin layer of sample. iii) Open sample container. iv) Inert gas flow. v) Slow heating rate.
Instrumentation Modern commercial instruments for thermogravimetry consists of: 1- A sensitive analytical balance. 2- A furnace. 3- A purge gas system for providing an inert (or sometimes reactive atmosphere). 4- A microcomputer/microprocessor for instrument control and data acquisition and display. 5- A purge gas switching system is a common option for applications in which the purge gas must be changed during an experiment.
Instrumentation LINSEIS L81
The balance • A number of different thermobalance designs are available commercially. • Capable of providing quantitative information about samples ranging in mass from 1 mg to 100 mg. • Common type balance: has a range of 5 to 20 mg. • Sample holder of balance must be housed in the furnace. But the rest of the balance must be isolated from the furnace. • A change in sample mass causes a deflection of the beam which interposes a light shutter between a lamp and one of two photodiodes. • The resulting imbalance in the photodiode current is amplified and fed into coil which is situated between the poles of a permanent magnet. • The magnetic field generated by the current in the coil restores the beam to its original position. • The amplified photodiode current is monitored and transformed into mass or mass loss information by the data acquisition system.
Balances must remain precise and accurate continuously under extreme temperature and atmosphere conditions, and should deliver a signal suitable for continuous recording. • Null-deflection weighing mechanisms are favoured in TG as they ensure that the sample remains in the same zone of the furnace irrespective of changes in mass. • Sensitivity of balance 1g for a 1g maximum load balance. • The output weight signal may be differentiated electronically to give a derivative thermogravimetric curve (DTG)
The Furnace • For TGA ,T range is from ambient to 1500 oC. • The heating and cooling rate of the furnace can be selected from >0 to 200 oC/min. • Insulation and cooling to the exterior of the furnace is required to avoid heat transfer to the balance. • Nitrogen or argon are usually used to purge the furnace and prevent oxidation of the sample. • For some analysis it is desirable to switch purge gases as the analysis proceeds (different gases used (N2, O2, air, CO2, He, Ar, etc. at controlled rate). • The furnace is normally an electrical resistive heater.
Some basic requirements of the heating chamber are: • be non-inductively wound لا تعمل توصيل حثي. • be capable of reaching 100 to 200°C above the maximum desired working temperature. • have a uniform hot-zone of reasonable length. • reach the required starting temperature as quickly as possible. • not affect the balance mechanism through radiation or convectionالحمل الحراري. • In order to overcome the problem of possible temperature gradient, infrared or microwave radiation have been used in some equipment. Infrared heating: use halogen lamp, temperature up to 1400°C, heating rate can be as high as 1000°C/min, accuracy is about ±0.5°C. Microwave heating: large sample can be used because uniform heating generated within sample but temperature measurement and power control are difficult.
Constant heating rate: lag behind of the sample temperature During heating a temperature difference between the furnace and the sample temperature appears which means that the sample temperature lags always behind the furnace temperature. Measurement of the melting point of Di-tert.-biphenyle at different heating rates.
Gradual raise of temperature Thermal equilibrium is better reached by gradual raise of the temperature.
The atmosphere • Sort, pressure and flow rate of the gas in the sample chamber influence the following parameters: • Sample reaction • Sample reactions with the gas (oxidation in the presence of oxygen). • Heat transitions • Different heat conductivity of the gases used in an experiment. • Buoyancy طفو and current effects • Different density and flow rate of the gases used in an experiment. For all thermoanalytical investigations it is very important to report the sort, the pressure and the flow rate of the gases used in the experiment.
Thermal decomposition temperatures for CaCO3 in different gas atmospheres
SOURCES OF ERRORS IN TGA There are a number of sources of error in TGA, and they can lead to inaccuracies in • The recorded temperature and mass data. Some of the errors may be corrected by: • Placing the thermobalance at proper place and handling it with great care. • For understanding we are discussing some common source of errors during operation of a thermobalance. • i) Buoyance effectتأثير الطفو : If a thermally inert crucible is heated when empty there is usually an apparent weight change as temperature increases. This is due to effect of change in buoyancy of the gas in the sample environment with the temperature, the increase convection (الحمل الحراري)and possible effect of heat from the furnace in the balance itself.
Now, in most modern thermobalances, this effect is negligible. However, if necessary, a blank run with empty crucible can be performed over the appropriate temperature range. The resultant record can be used as a correction curve for subsequent experiment performed in the same condition. • ii) Condensation on balance suspension: Condensation of the sample will also affect the mass of the sample and consequently the shape of TG curve . • This can be avoided by maintaining a dynamic atmosphere around the sample in the furnace so that all the condensable product may be driven by the flowing gases. • iii) Random fluctuation of balance mechanism • iv) Reaction between sample and container • v) Convection effect from furnace • vi) Turbulence effect from gas flow
vii) Induction الحث effect from furnace • Errors of type (iii) can be avoided by proper placing of balance in the laboratory. • Error (v) can be avoided by sensible choice of sample container. • Last three errors (v-vii) have to be considered in the design of the furnace, the balance and its suspension system. By avoiding excessive heating rate and proper gas flow rate some of above mentioned errors may be avoided. In the light of above discussion it is necessary to calibrate thermobalance before to use. • Calibration of thermobalance for the measurement of mass: It can be done by adding known mass of the sample container and noting the reading of the chart. • Temperature calibration: ferromagnetic standards are used for this purpose. In a magnetic field there substances shown detectable mass changes. The ferromagnetic standards are quite suitable for the temperature range from 242 to 771° C.
Thermbalance are normally housed in glass or metal system to allow for operation at pressures ranging from high vacuum (< 10-4 Pa) to high pressure (>3000 kPa) of inert, oxidizing, reducing or corrosive gases. • Care must be taken to correct for buoyancy arising from the lack of symmetry in the weighing system • Thermal convection الحمل الحراريis responsible for noise in the signal of TG. • The use of dense carrier gases at high pressures in hot zones with large temperature gradients give the most noise. • Fitting of convoluted bafflesحواجز ملتوية was found to be most successful in reducing thermal convection.
Instrument control/data handling • The T recorded in a thermogram is ideally the actual T of the sample. • This T can be obtained by immersing a small thermocouple directly in the sample. Problems: This procedure is seldom followed because of catalytic decomposition of samples, potential contamination of samples and weighing errors resulting from the thermocouple leads. Another method: Problems reduced by measuring T with a small thermocouple located as close as possible to the sample container. Modern thermobalances: Usually use a computerized T control routine that automatically compares the voltage output of the thermocouple with a voltage versus T table that is stored read only memory ROM. The voltage difference is used to adjust the voltage of the heater. (achieving agreement between specified T program and T of sample).
The sample • Sample form, defect content, porosity and surface properties has influence to the behaviour on heating, e.g. single crystal sample give different response from powdered sample • Large sample size cause problems like heat transfer, and gas exchange with the surrounding is reduced; in general, the use of small (~ 20 mg) specimen is preferable if sensitivity of balance permits • Sample should be powdered and spread thinly and uniformly in the container
Decomposition temperatures of CaCO3 as function of crucibles
Temperature measurement and calibration • Platinum resistance thermometers or thermocouples are used for temperature measurement. • Large difference between sample temperature (Ts) and furnace temperature (Tf) can exist, sometime as high as 30°C. Calibration is thus needed. • The difference or lag is more marked when operating in vacuum or in fast flowing atmosphere and with high heating rate.
Temperature calibration for small furnace can be done by making use of the melting point or Curie points of a range of metals and alloys. • A series of high purity wires may be suspend in the region where the specimen crucible would normally be located. If the furnace temperature is slowly raised through the melting point of a particular wire, a significant weight loss will be recorded when the wire melts. • A series of fusible wire, such as : indium (156.63°C), lead (327.5°C), zinc (419.58°C), aluminium (660.37°C), silver (961.93°C), and gold (1064.42°C) should give a reasonable calibration curve. hanger of sample pan furnace different metal wires thermocouple
Calibration can also be done by placing a series of ferromagnetic materials in the specimen basket and a magnet below or above it, external to the furnace. When each material goes through its Curie temperature (ferro- to paramagnetic transition), a sharp ‘weight’ change will be indicated. Using mixtures, a multi-point temperature calibration can be performed. e.g. Curie points (in oC) of alumel 163; Ni 354; perkalloy 596; Fe 780; Hisat 1000.
Interpretation of TG and DTG curves • The sample undergoes no decomposition with loss of volatile products over the temperature range shown but solid phase transformation, melting ,etc can not be detected by TG, • The rapid initial mass loss is characteristic of desorption or drying. If it is true, then re-run the sample should result in type (i) curves, • Single stage decomposition, • Multi-stage decomposition with relatively stable intermediates : provide information on the temperature limit of stability of reactants and intermediate products and also stoichiometry, • Multi-stage decomposition with no stable intermediate product. However heating-rate effect must be considered. At low heating rate, type (v) resemble type (iv). At high heating rate, type (iv) and (v) resemble type (iii) and lose all the details, • Gain in mass due to reaction with atmosphere, e.g. oxidation of metals, • Oxidation product decompose again at higher temperature; this is not often encountered. Resolution of stages can be improved by recording DTG or by digital differentiation of TG data.
Preparing the measurement • General advices: • Exact characterization of the starting materials (purity, grain size)!. • Large amount of the starting material for repeated and further measurements. • Removal of absorbed water by drying (m must be constant). • Use samples with narrow grain size distribution (Sieving). • For measurement in vacuum no sample with a grain size below 60 mesh (0.25 mm) (a part of the sample can be lost).
Applications of TG • Only for studying thermal events accompanied by mass change • Provide valuable information for desorption, decomposition and oxidation. e.g. dehydration of CuSO4·5H2O TG curve for CaSO42H2O at different water-vapour pressure TG curve for CuSO45H2O
knowledge of thermal stability can give information on problems like the hazards of storing explosives, shelf life of drugs, etc. • The thermal balance in a TG equipment can also be used to measure vapour pressure of a sample and magnetic susceptibility, etc. • ATTN: • Three factors should be noted when you get a TG curve: • General shape, • The particular temperatures at which changes in mass occur (severely affected by many experimental conditions), • The magnitudes of the mass changes can be used for precise quantitative analysis.
Analytical calculations Under controlled and reproducible conditions, quantitative data can be extracted from the relevant TG curves. Most commonly, the mass change is related to sample purity or composition. Example:A pure compound may be either MgO, MgCO3, or MgC2O4. A thermogram of the substance shows a loss of 91.0 mg from a total of 175.0 mg used for analysis. What is the formula of the compound? The relevant possible reactions are MgO No reaction MgCO3 MgO+CO2 MgC2O4 MgO+CO2+CO Solution: % Mass loss Sample=(91.0/175.0)(100%)=52.0 % Mass loss if MgCO3=(44/84.3)(100%)=52.2 % Mass loss if MgC2O4=((44+28)/112.3)(100%)=64.1 If the preparation was pure, the compound present is MgCO3.