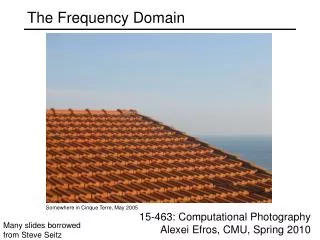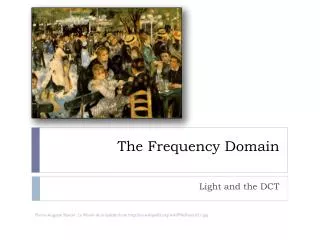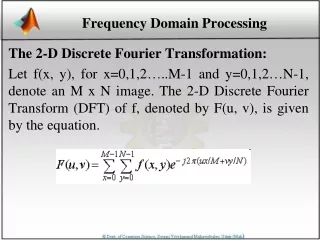
Frequency Domain
Frequency Domain. The frequency domain - the goal is to represent an image as a weighted sum of sinusoidal functions a periodic function - a sinusoid function images of sinusoidal functions . What do we mean by the term “ Frequency Domain”?.


Frequency Domain
E N D
Presentation Transcript
Frequency Domain • The frequency domain • - the goal is to represent an image as a weighted sum of sinusoidal functions • a periodic function - a sinusoid function • images of sinusoidal functions
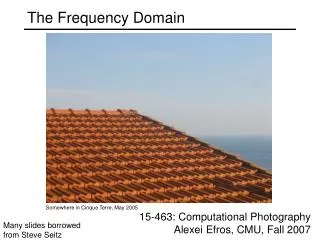
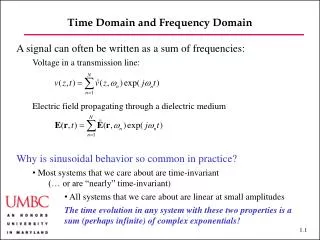
What do we mean by the term “ Frequency Domain”? We can visualize&analyze a signal or a filter in either the spatial domain or the frequency domain • Spatial domain: x, distance ( usually in pixels) • Frequency domain: can be measured with either: • , angular frequency in radians per unit distance,or • f, rotational frequency in cycles per unit distance. =2f • The period of a signal, T=1/f= 2/ • Examples: • The signal [0 1 0 1 0 1…] has frequency f=.5 (.5 cycles per sample)
Frequency Domain The frequency domain is a space in which each image value at image position F represents the amount that the intensity values in image I vary over a specific distance related to F. In the frequency domain, changes in image position correspond to changes in the spatial frequency, (or the rate at which image intensity values) are changing in the spatial domain image I. For example, suppose that there is the value 20 at the point that represents the frequency 0.1 (or 1 period every 10 pixels). This means that in the corresponding spatial domain image I the intensity values vary from dark to light and back to dark over a distance of 10 pixels, and that the contrast between the lightest and darkest is 40 gray levels (2 times 20). In most cases, the Fourier Transform is used to convert images from the spatial domain into the frequency domain and vice-versa.
The spatial domain is the normal image space, in which a change in position in image I directly projects to a change in position in scene S. Distances in I (in pixels) correspond to real distances (e.g. in meters) in S. We can also discuss the frequency with which image values change, that is, over how many pixels does a cycle of periodically repeating intensity variations occur. One would refer to the number of pixels over which a pattern repeats (its periodicity) in the spatial domain. A related term used in this context is spatial frequency, which refers to the (inverse of the) periodicity with which the image intensity values change. Image features with high spatial frequency (such as edges) are those that change greatly in intensity over short image distances. Spatial Domain The spatial frequency domain is interesting because: 1) it may make explicit periodic relationships in the spatial domain, and 2) some image processing operators are more efficient or indeed only practical when applied in the frequency domain.
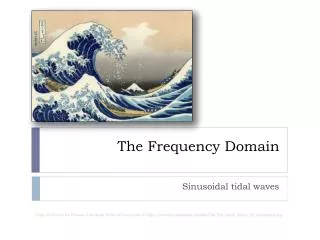
Spatial frequency Frequency has a precise meaning when we consider periodic functions. A periodic function such as the sinusoid is Figure 8.1 ( page 189) consists of fixed pattern or cycle that repeats endlessly in both directions. The length of this cycle , L , is known as the period of the function . The frequency of variation is the reciprocal of the period. If the variation is spatial and L is a distance, then 1/L is termed the spatial frequency of the variation. A periodic variation is characterized by two further parameters: an amplitude and a phase. The amplitude ( labeled A is the size of the variation- the height of a peak or dept of a trough. The phase ( ) is the position of the start of a cycle , relative to some reference point ( the origin) A sine function has =0, whereas a cosine function has = /2
Spatial frequency * period - length of the cycle, L * frequency - 1/L * if L is a distance, 1/L is the spatial frequency * amplitude - height of the peak, A * phase - position of the start of a cycle
A periodic function - a sinusoid function A function f(x) is said to be periodic with period p if for n = 1, 2, .... For example, the sine function , is periodic with period (as well as with period , , , etc.).
A periodic function - a sinusoid function One of the basic trigonometric functions encountered in trigonometry. Let be an angle measured counterclockwise from the x-axis along the arc of the unit circle Then is the vertical coordinate of the arc endpoint. As a result of this definition, the sine function is periodic with period . By the Pythagorean theorem , also obeys the identity The definition of the sine function can be extended to complex arguments z using the definition where e is the base of the natural logarithm and i is the imaginary number The sine function can be defined algebraically by the infinite sum
Images of sinusoidal functions We can present image using sinusoidal variation of the x axis, about a mean gray level of 128. Amplitude, A is a value in the range [1,127], N is the width of the image, in pixels. The parameter u is a dimensionless spatial frequency, corresponding to the number of complete cycles of the sinusoid that fit into the width of the image Where: - u is the spatial frequency - number of cycles that fit into the width of the image - u/N is cycles per pixel -
Images of sinusoidal functions Of course, we can also have sinusoidal variation in the y direction. We can introduce a second spatial frequency parameter , v, representing the number of cycles of variation that span the height of the image, to deal with this.
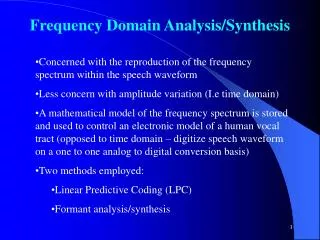
Fourier theory- Basic concepts • Basic concepts: • - any periodic function can be represented as a sum of simple sinusoids • - basis functions - sine and cosine functions of a given frequency • - Fourier series - weighted sum of basis functions - equation 8.2 • n is the frequency of a basis function - number of cycles that fit into one period L • - Fourier series representation of f(x) can be given by two 1D arrays (of infinite size) of coefficients • - Fourier coefficients - weighting factors for each sine and cosine function • - example - summation of sinusoids can generate
Fourier theory- Basic concepts A set of sine and cosine functions having particular frequencies are chosen for image representation. These are termed the basis functions of the representation. A weighted sum of these basic functions is called a Fourier series. The weighting factors for each sine and cosine function are known as the Fourier coefficients. We can write the summation as follows: The index n is the number of cycles of the sinusoid that fit within a one period of f(x). Thus n can be considered as a dimensionless measure of the frequency of a basis function.
2D Fourier series 1)use 2D sine and cosine functions - equation 8.3 2)Fourier series representation of f(x,y) can be given by two 2D arrays (of infinite size) of coefficients 3)basis images - figure 8.7 4)coefficients determine contributions of each basis image to the representation 5) Fourier series
2D Fourier series where u and v are the number of cycles fitting into one horizontal and vertical period , respectively of f(x,y). We can regard the Fourier series representation of f(x,y) as a pair of two-dimensional arrays of coefficients, each of infinite extent. The Fourier series can be used to represent any image. We can visualize the basis function as “basic images” – see Figure 8.7. The coefficients au,v and bu,v determine the relative contributions of each basis image to the representation
2D Fourier series Fourier series are expansions of periodic functions f(x) in terms of an infinite sum of sines and cosines. Fourier series make calculate the coefficients and in the sum. The computation and use of the orthogonality relationships of the sine and cosine functions, which can be used to study of Fourier series is known as harmonic analysis. Two functions f(x) and g(x) are orthogonal on the interval if
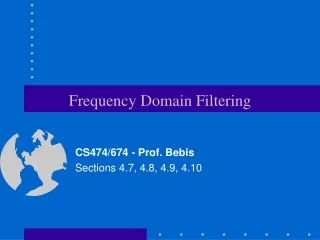
Fourier Transform The Fourier Transform is an important image processing tool which is used to decompose an image into its sine and cosine components. The output of the transformation represents the image in the Fourier or frequency domain, while the input image is the spatial domain equivalent. In the Fourier domain image, each point represents a particular frequency contained in the spatial domain image. The Fourier Transform is used in a wide range of applications, such as image analysis, image filtering, image reconstruction and image compression.
The original curve has been sampled over 512 points, which means that, according to the theory we can simulate it with the sum of 256 sine wave, which can have any amplitude and any phase difference from the original signal. The first of the sine waves has a frequency of 0 which means it is just a straight line and this always has the average value of the signal. The second has a frequency 1 (i.e. there is one wave in the original length of the signal). This has been drawn so that it starts and finishes at 0 but it can be moved to the left or right by any distance required to make it fit. The peak to peak height can also take on any value. The third sine wave has a frequency of two etc. The FFT software calculates the set of these waves with frequencies from 0 to 255 which will add up to give exactly the original wave. The result is a list of 256 pairs of numbers: we already know the frequencies (the first is 0 the second 1 etc) so these pairs of numbers are just the amplitude of each sine wave and the phase shift which must be applied to make it fit. This all the information we need to recreate the original waveform but before we do that we can filter it by editing the numbers.
When applying Fourier transform to images, we must deal explicitly with the fact that an image is : 1)Two –dimensional 2)Sampled 3)Of finite extent Discrete Fourier Transform (DFT) The DFT is the sampled Fourier Transform and therefore does not contain all frequencies forming an image, but only a set of samples which is large enough to fully describe the spatial domain image. The number of frequencies corresponds to the number of pixels in the spatial domain image, i.e. the image in the spatial and Fourier domain are of the same size. For a square image of size N×N, the two-dimensional DFT is given by:
Discrete Fourier Transform (DFT) – How is works Euler’s formula Noting that and DFT can be written is exponential form: where f(x,y) is the image in the spatial domain and the exponential term is the basis function corresponding to each point F(u,v) in the Fourier space. The equation can be interpreted as: the value of each point F(u,v) is obtained by multiplying the spatial image with the corresponding base function and summing the result. The basis functions are sine and cosine waves with increasing frequencies, i.e.F(0,0) represents the DC-component of the image which corresponds to the average brightness and F(N-1,N-1) represents the highest frequency.
Math Review Most functions ( including sine, cosine and ex) can be represented as an infinite sun of polynomial terms Letting x= j, Euler’s formula becomes obvious to the most casual observer:
Inverse Fourier transform In a similar way, the Fourier image can be re-transformed to the spatial domain. The inverse Fourier transform is given by: The only material difference is the sigh of the exponent. It is clear that the forward transform of an N x N image yields an N x N array of coefficients. Since the inverse transform reconstructs the original image from this set of coefficients, they must constitute a complete representation of the information present in the image forward transform
Fast Fourier Transform Fourier Transform is separable, it can be written as where Using these two formulas, the spatial domain image is first transformed into an intermediate image using N one-dimensional Fourier Transforms. This intermediate image is then transformed into the final image, again using N one-dimensional Fourier Transforms. Expressing the two-dimensional Fourier Transform in terms of a series of 2N one-dimensional transforms decreases the number of required computations.
Fast Fourier Transform Even with these computational savings, the ordinary one-dimensional DFT has N2complexity. This can be reduced toNLog2N if we employ the Fast Fourier Transform (FFT) to compute the one-dimensional DFTs. This is a significant improvement, in particular for large images. There are various forms of the FFT and most of them restrict the size of the input image that may be transformed, often to N=2n where n is an integer.
Image Transformations – Math Review • Let an image f be represented as an M x N matrix of integer numbers (1) • General transform (2) can be rewritten as (3)
Image Transformations - Math Review • If P and Q are non-singular (non-zero determinants), inverse matrices exist and (4) • If P and Q are both symmetric (M=M^T), real, and orthogonal (M^T M = I), then (5) and the transform is an orthogonal transform.
Fourier transform - Math Review • Let JJ be a transform matrix of size J x J : (6) • The discrete Fourier transform can be defined according to equation (2) (7) (8) • The kernel function of the discrete transform (.8) is
The spectra of an image The Fourier Transform produces a complex number valued output image which can be displayed with two images, either with the real and imaginary part or with magnitude and phase. In image processing, often only the magnitude of the Fourier Transform is displayed, as it contains most of the information of the geometric structure of the spatial domain image. However, if we want to re-transform the Fourier image into the correct spatial domain after some processing in the frequency domain, we must make sure to preserve both magnitude and phase of the Fourier image.
The result of an FFT is always a complex number. This however, is not complicated, all it means is that we get a pair of numbers and from this pair we can calculate the pair of numbers we really want from each harmonic: the amplitude and phase (often called the modulus and argument). The spectra of an image The result of the FFT is a complex number C = a + ib illustrated as the point on the diagram. The position of this point can also be described by the distance from the center of the diagram A and the angle q with the real axis. A is amplitude (or modulus) and q is phase (or argument). Simple algebra tells us that
Fourier spectra play an important role • The Fourier transform of a real function is a complex function where R(u,v) and I(u,v) are, respectively, the real and imaginary components of F(u,v). • The magnitude function |F(u,v)| is called the frequency spectrum of image f(m,n). The magnitudes correspond to the amplitudes of the basis images in our Fourier representation. The array of magnitudes is termed the amplitude spectrum of the image
Fourier spectra play an important role The array of phases is termed the phase spectrum. When the term “spectrum” is used on its own, the amplitude spectrum is normally implied. The power spectrum of an image is simply the square of its amplitude spectrum :