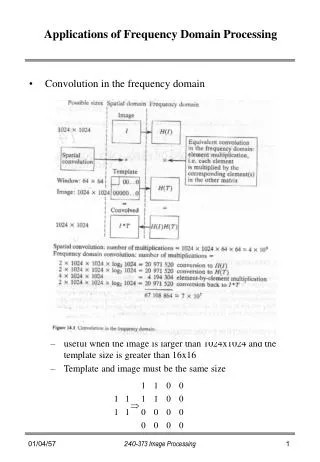
Frequency Domain Processing
Frequency Domain Processing. Fourier transform offers considerable flexibility in the design and implementation of filtering solutions in areas such as image enhancement, image restoration, image data compression and a lot of other applications of practical interest. Introduction

Frequency Domain Processing
E N D
Presentation Transcript
Frequency Domain Processing • Fourier transform offers considerable flexibility in the design and implementation of filtering solutions in areas such as image enhancement, image restoration, image data compression and a lot of other applications of practical interest. • Introduction • Any function that periodically repeats itself can be expressed as the sum of sines and cosines of different frequencies, each multiplied by a different coefficient. • This is called Fourier series. • It does not matter how complicated the function is. • Thus any complicated function can be expressed as a sum of simple sines and cosines.
Frequency Domain Processing • Even functions that are not periodic (but whose area under the curve is finite) can be expressed as the integral of sines and cosines multiplied by a weighting function. • This is called Fourier transform. • In the case of both Fourier series and Fourier Transform, one can reconstruct (recover) the function via an inverse process, without any loss of information. • Thus one can go to Fourier domain and work there and then return to the original spatial domain of the function without losing any information.
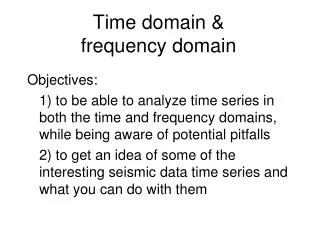
A function at the bottom is the sum of the four periodic functions above
The 1-D Discrete Fourier Transform • The Fourier transform of a discrete function of one variable, f(x), x=0,1,2,…,M-1 is given as: • F(u,v) = Σ f(x).e -j2π(ux/M ) • x=0,M-1 • for u = 0,1,2,...,M-1. • Here we start substituting u =0 in the exponential term and then summing for all values of x. • We then substitute u =1 in the exponential and repeat the summation over all the values of x. • We repeat this process for all M values of u to get the Fourier transform.
The 1-D Discrete Fourier Transform • Each term of the Fourier transform (i.e. the value of F(u) for each value of u) is composed of the sum of all values of the function f(x). • The values of f(x), are multiplied by sines and cosines of various frequencies. • One can compare the Fourier transform to a glass prism. • The prism is a physical device that separates light into various color components, each based on its wavelength (or frequency). • The Fourier transform can be considered as a ‘Mathematical prism’ that separates a function into various components, based on frequency content.
The 1-D Discrete Fourier Transform • Given F(u), we can get the original function using inverse DFT: • f(x) = (1/M) Σ F(u) e j2π(ux/M ) • u=0,M-1 • for u = 0,1,2,…,M-1. • Figure (a) below shows a function and (b) shows its Fourier spectrum. • Here M = 1024, A = 1 and K is only 8 points. • The spectrum is centered at u = 0. • One can show that this can be achieved by multiplying f(x) by (-1)x before taking the transform.
The 1-D Discrete Fourier Transform • The Figure below shows the results for K=16 points. We find • 1) the height of the spectrum doubled as the area under the curve in the x-domain doubled • 2) the number of zeros in the spectrum in the same interval doubled as the length of the function doubled. • Note the reciprocal nature of the Fourier transform pairs. • That means Δx and Δu are inversely related by the equation: • Δu = (1/(M. Δx))
(a) A discrete function of M points, and (b) its Fourier spectrum. (c) A discrete function with twice the number of nonzero points, and (d) its Fourier spectrum.
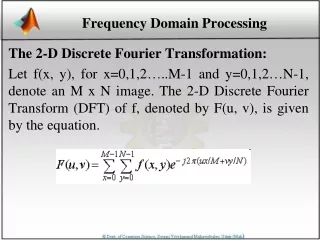
The 2-D Discrete Fourier Transform • Let f(x,y), for x=0,1,2,…,M-1 and y=0,1,2,…,N-1, denote the M X N image. • The 2-D, discrete Fourier Transform (DFT) of f, denoted as F(u,v), is given as: • F(u,v) = ΣΣ f(x,y).e -j2π(ux/M + vy/N) • x=0,M-1 y=0,N-1 • for u=0,1,2,...,M-1 and v = 0,1,2,...,N-1. • Here u and v are the frequency variables and x and y are the spatial variables. • The M X N regions defined by u = 0,1,2,…,M-1 and v = 0,1,2,…,N -1 is called as frequency rectangle. • This rectangle size is same as that of image size.
The inverse, discrete Fourier transform It is given as: • f(x,y) = (1/MN) Σ Σ F(u,v) e j2π(ux/M + vy/N) • u=0,M-1 v=0,N-1 • for x = 0,1,2,…,M-1 and y = 0,1,2,…,N-1. • Here for a given F(u,v), we can get f(x,y) back by means of the inverse DFT. • The values of F(u,v) here are called as Fourier coefficients. • In some formulations of the DFT, the (1/MN) term is placed in front of the transform and in others it is used in front of the inverse. • Sometimes, both equations are multiplied by (1/sqrt(M*N)). • Note that the array indices in Matlab start at 1 rather than 0. • Hence F(1,1) and f(1,1) in Matlab correspond to the mathematical quantities F(0,0) and f(0,0) in the transform and its inverse.
2D Fourier Transform • The value of the transform at the origin of the frequency domain (i.e., F(0,0)) is called the dc component of the Fourier transform. • Here dc signifies direct current (current of zero frequency). • One can show that F(0,0) is equal to MN times the average value of f(x,y). • Even if f(x,y) is real, its transform is complex in general. • Let R(u,v) and I(u,v) represent the real and imaginary components of F(u,v). • Then the Fourier spectrum is defined as • | F(u,v) | = [ R2(u,v) + I2(u,v) ]1/2 • The phase angle of the transform is defined as • φ(u,v) = tan-1 [ I(u,v) / R(u,v) ]
2D Fourier Transform • In polar form, the above equations become • F(u,v) = | F(u,v) | e –jφ(u,v) • The power spectrum or spectral density is defined as the square of the magnitude: • P(u,v) = | F(u,v) |2 = R2(u,v) + I2(u,v) • While plotting one can even view | F(u,v)| or P(u,v). • If f(x,y) is real, its Fourier transform is conjugate symmetric about the origin; that is • F(u,v) = F*(-u, -v) • This implies that the Fourier spectrum also is symmetric about the origin.
2D Fourier Transform • By direct substitution, we can show that • F(u,v) = F(u + M, v) = F(u, v + N) = F(u + M, v + N) • This implies that DFT is infinitely periodic in both u and v directions, with the periodicity M and N. • The same is true in the inverse DFT also. • Hence it is common practice to multiply the input image function by (1-)x+y prior to computing the Fourier transform. • Due to the properties of exponentials, we can show that: • Ғ[f(x,y)(-1) x+y] = F(u-(M/2), v – (N/2)).
2D Fourier Transform • Here Ғ[.] denotes Fourier transform of the argument. • This equation implies that the origin of the Fourier transform of f(x,y) (-1) x+y [i.e, F(0,)] is located at u = M/2 and v = N/2. • Multiplying f(x,y) by (-1) x+y shifts thr origin of F(u,v) to frequency coordinates (M/2, N/2) which is the center of the M X N area occupied by the 2-D DFT. • In order to ensure that the shifted coordinates are integers, we insist that M and N be even numbers. • The value of the transform at (u,v) = (0,0) is • F(0,0) = (1/(MN)) ΣΣ f(x,y) • X=0,M-1 y=0,N-1 • This is the average of f(x,y). • If f(x,y) is an image, the value of the Fourier transform at the origin is equal to the average gray level of the image.
2D Fourier Transform • Figure below shows a white rectangle of size 20 X 40 pixels superimposed on a black background of size 512 X 512 pixels. • This image is multiplied by (-1)x+y prior to computing the Fourier transform to center the spectrum as shown in Figure below. • Here the separation of spectrum zeros in the u-direction is exactly twice the separation of zeros in the v-direction. • This corresponds inversely to the 1 to 2 size ratio of the rectangle in the image. • The spectrum is displayed using log transformation to enhance gray level detail.
a) Image of a 20 x 40 white rectangle on a black background of size 512 x 512 pixels. (b) Centered Fourier spectrum show after application of the log transformation
Basic properties of the frequency domain • In a 2D DFT each term of F(u,v) contains all values of f(x,y), modified by the values of the exponential terms. • Hence one can not make direct associations between specific components of an image and its transform. • Since frequency is directly related to rate of change, it is not difficult to associate frequencies in the Fourier transform with patterns of intensity variations in an image.
Basic properties of the frequency domain • As we move away from the origin of the transform, the low frequencies correspond to the slowly varying components of an image. • For example, in an image of a room, these might correspond to smooth gray-level variables on the walls and floors. • As we move further away from the origin, the higher frequencies begin to correspond to faster and faster gray level changes in the image. • These correspond to edges of objects and other components of an image characterized by abrupt changes in gray level, such as noise.
Basics of filtering in the frequency domain • Filtering in the frequency domain consists of following steps: • Multiply the given image by (-1) (x+y) to center the transform. • Compute F(u,v), the DFT of the image. • Multiply F(u,v) by a filter function H(u,v). • Computer the inverse DFT of the previous result. • Get the real part of the result of the above step. • Multiply the above result by (-1) (x+y).
Basics of filtering in the frequency domain • Here H(u,v) suppresses certain frequencies in the transform while leaving others unchanged and hence we call it as filter transfer function or filter. • The Fourier transform of the output image is given as: • G(u,v) = H(u,v)F(u,v). • Here the multiplication of H and F involves two-dimensional functions and is defined on an element-by-element basis. • i.e, the first element of H multiplies the first element of F, the second element of H multiplies the second element of F and so on. • In general, the components of F are complex quantities, but the filters that we use are real ones. • In our case, the filters do not change the phase of the transform and hence we call it as zero-phase-shift filters.
Basics of filtering in the frequency domain • The filtered image is obtained by taking the inverse Fourier transform of G(u,v): • Filtered Image = Ғ-1[G(u,v)]. • The final image is got by taking the real art of this result and multiplying it by (-1) (x+y). • The inverse Fourier transform is, in general, complex. • The filtering procedure is summarized as follows: • Here the pre and post processing includes, cropping of the input image to its closest even dimension, gray-level scaling, conversion to floating point on input and conversion to an 8-bit integer format on the output, etc.
Some basic filers and their properties • Let us see some specific filters and how they affect images. • If we set the value of F(0,0) to zero and take the inverse transform, then the average value of the resulting image will be zero. • We can do this operation by multiplying all values of F(u,v) by the filter function: • H(u,v) = 0 if (u,v) = (M/2, N/2) • = 1 otherwise • This filter would set F(0,0) to zero and leave all other frequency components of the Fourier transform untouched. • This filter is called the notch filter because it is a constant function with a hole (notch) at the origin.
Some basic filers and their properties • A filter that attenuates high frequencies while passing low frequencies is called a low pass filter. • A filter that has the opposite characteristic is called a high pass filter. • A low pass filtered image has less sharp detail than the original because high frequencies have been attenuated. • Similarly highpass-filtered images would have less gray level variations in smooth areas and emphasized transitional (edge) gray-level detail. • Such an image will appear sharper.
A two-dimensional low pass filter function and the result of lowpass filtering the image.
% Gaussian Low-Pass Filter clear all; close all ;clc; f = imread('test_pattern.tif'); figure,imshow(f); PQ = paddedsize(size(f)); D0 = 40; H = lpfilter('gaussian',PQ(1), PQ(2), D0); H1 = fftshift(H); surf(H1(1:10:PQ(1), 1:10:PQ(2))) colormap([0 1 0.5]); axis off figure,imshow(H1,[]); g = dftfilt(f, H); figure, imshow(g, []);
A two-dimensional highpass filter function and the result of highpass filtering the image.
% Gaussian High-Pass Filter clear all; close all ;clc; f = imread('test_pattern.tif'); figure,imshow(f); PQ = paddedsize(size(f)); D0 = 100; H = hpfilter('gaussian',PQ(1), PQ(2), D0); H1 = fftshift(H); surf(H1(1:10:PQ(1), 1:10:PQ(2))) colormap([0 1 0.5]); axis off figure,imshow(H1,[]); g = dftfilt(f, H); g = uint8(g); figure, imshow(g, []);
Correspondence between filtering in the spatial and frequency domains • The relationship between spatial and frequency domains is established by convolution theorem. • We know that the convolution is the process by which we move a mask from pixel to pixel in an image, and compute a predefined quantity at each pixel. • Thus the discrete convolution of 2 functions f(x,y) and h(x,y) of size M X N is denoted by f(x,y)*h(x,y) and is defined as: • f(x,y)*h(x,y) = (1/MN) ΣΣ f(m,n)h(x-m, y-n). • m=0,M-1 n=0,N-1
Correspondence between filtering in the spatial and frequency domains • Letting F(u,v) and H(u,v) denote the Fourier transforms of f(x,y) and h(x,y), respectively, one-half of the convolution theorem simply states that f(x,y)*h(x,y) and F(u,v)H(u,v) constitute a Fourier transform pair. • This is stated as: • f(x,y)*h(x,y) F(u,v)H(u,v). • Similarly the convolution in the frequency domain reduces to multiplication in the spatial domain as: • f(x,y)h(x,y) F(u,v)*H(u,v).
Correspondence between filtering in the spatial and frequency domains • An impulse function of strength A, located at (x0,y0), is denoted by : • Aδ(x - x0, y - y0) = As(x0,y0). • This equation implies that the summation of a function s(x,y) multiplied by an impulse is simply the value of the function at the location of the impulse, multiplied by the strength of the impulse. • Here Aδ(x - x0, y - y0) also is an image of size • M X N. • It is composed of all zeros, except at coordinates (x0,y0), where the value of the image is A.
Correspondence between filtering in the spatial and frequency domains • By letting either f or h to be an impulse function, and using the above equation, we would conclude that convolution of a function with an impulse “copies” the value of that function at the location of the impulse. • This characteristic is called the sifting property of the impulse function. • If the unit impulse is located at the origin, then: • ΣΣ s(x,y) δ(x,y) = s(0,0). • x=0,M-1 y=0,N-1
Correspondence between filtering in the spatial and frequency domains • We can compute the Fourier transform of a unit impulse at the origin as: • F(u,v) = (1/MN) ΣΣδ(x,y) e -j2π(ux/M + vy/N) • x=0,M-1 y=0,N-1 • = (1/MN). • Thus the Fourier transform of an impulse at the origin of the spatial domain is a real constant. • If the impulse were located elsewhere, the transform would have complex components. • In general, it is efficient to do the filtering in the frequency domain. • In spatial domain one has to use much smaller filter masks.
Gaussian filter • Filters based on Gaussian functions are important because their shapes are easily specified and both the forward and inverse Fourier transforms of a Gaussian function are real Gaussian functions. • The Gaussian filer function in the frequency domain is given as: • H(u) = A e -(u**2/2σ**2). • Here σ is the standard deviation of the Gaussian curve. • The corresponding filter in the spatial domain is: • h(x) = (√2π)σAe -(2π**2 σ**2 X**2) • Here both H(u) and h(x) are real and they behave reciprocally with respect to one another. • When H(u,v) has a broad profile (large value of σ), h(x) has a narrow profile and vice versa. • When σ reaches infinity, H(u) becomes a constant function and h(x) becomes an impulse.
Gaussian filter • Fig below shows a plot of a Gaussian filter in the frequency domain. • Note the shape of H(u) as a low pass filter. Gaussian frequency domain high pass filter. • Corresponding low pass spatial filter. Corresponding high pass spatial filter. • A glaring similarity between the 2 filters is that all the values are positive in both domains. • We can implement low pass filtering in the spatial domain by using a mask with all positive coefficients. • The narrower the frequency domain filter, the more it will attenuate the low frequencies, resulting in increased blurring. • In the spatial domain this means a wider filter, which in turn implies a larger mask.
Fig below shows a plot of a Gaussian filter in the frequency domain. Note the shape of H(u) as a low pass filter. Gaussian frequency domain high pass filter. Corresponding low pass spatial filter. Corresponding high pass spatial filter.
Gaussian filter • We can construct a high pass filter as a difference of Gaussians, as: • H(u) = Ae-(u**2/2*σ1**2) - B e-(u**2/2*σ2**2) • With A ≥ B and σ1 > σ2. The corresponding filter in the spatial domain is: • h(x) = (√2π)σ1Ae -(2π**2 σ1**2 x**2) – • (√2π)σ2A e-(2π**2 σ2**2 x**2) • The plots of these 2 functions are are shown above. • We see that the spatial filter has both negative and positive values. • Once the values turn negative, they never turn positive again.
Smoothing Frequency-Domain Filters We consider 3 types of lowpass filters: ideal, Butterworth and Gaussian filters. These 3 filters cover the range from very sharp (ideal) to very smooth (Gaussian) filter functions. The Butterworth filter has a parameter, called the filter order. For high values of this parameter the Butterworth filter approaches the form of the ideal filter. For lower-order values, the Butterworth filter has a smooth form similar to the Gaussian filter. Thus the Butterworth filter is a transition between two extremes.
Ideal Lowpass Filters • This filter “cuts off” all high frequency components of the Fourier transform that are at a distance greater than a specified distance D0 from the origin of the (centered) transform. Such a filter is called a two-dimensional ideal lowpass filter (ILPF) and has the transfer function • H(u,v) = 1 if D(u,v) ≤ D0 • = 0 if D(u,v) > D0 • Where D0 is a nonnegative quantity and D(u,v) is the distance from point (u,v) to the center of the filter. The locus of points for which D(u,v) = D0 is a circle. Noting that the filter H multiplies the Fourier transform of an image, we see that an ideal filter “cuts off” (multiplies by 0) all components of F outside the circle and leaves unchanged (multiplies by 1) all components on or inside, the circle. This filter is not realizable in analog form using electronic components. But the digital realization explains wraparound error.
(a) Original image. (b)-(f) Results of ideal low pass filtering with cut off frequencies set at different radii values of 5 15 30 80 and 230
code • % Ideal Low-Pass Filter • clear all; close all ;clc; • f = imread('test_pattern.tif'); • %f = imresize(f,[256,256]); • figure,imshow(f); • PQ = paddedsize(size(f)); • D0 = 230; • H = lpfilter('ideal',PQ(1), PQ(2), D0); • H1 = fftshift(H); • figure,surf(H1(1:10:PQ(1), 1:10:PQ(2))) • colormap([0 1 0.5]); • axis off • figure,imshow(H1,[]); • g = dftfilt(f, H); • figure, imshow(g,[]);
Butterworth lowpass filter (BLPF) • Butterworth lowpass filter (BLPF) of order n, with a cutoff frequency at a distance D0 from the origin, has the transfer function • H(u,v) = 1/[1 + D(u,v)/ D0 ]2n • The BPLF transfer function does not have a sharp discontinuity at D0.
(a) Original image. (b)-(f) Results of BLPF with n = 2 and D0 equal to different radii valuesof 5 15 30 80 and 230.
code • % Butterworth Low-Pass Filter • clear all; close all ;clc; • f = imread('test_pattern.tif'); • figure,imshow(f); • PQ = paddedsize(size(f)); • %D0 = 0.07*PQ(1); • D0 = 5; • H = lpfilter('btw',PQ(1), PQ(2), D0,2); • H1 = fftshift(H); • figure,surf(H1(1:10:PQ(1), 1:10:PQ(2))) • colormap([0 1 0.5]); • axis off • figure,imshow(H1,[]); • g = dftfilt(f, H); • figure, imshow(g, []);
Here there is a smooth transition in blurring as a function of increasing cutoff frequency. No ringing is visible in this filter implying smooth transition between low and high frequencies.
Gaussian lowpass filter (GLPF) • Gaussian lowpass filter (GLPF) is defined as: • H(u,v) = e-D**2(u,v)/2σ**2 • Here σ is the standard deviation. • If σ = D0, we get H(u,v) = e-D**2(u,v)/2D0**2 • GLPF did not achieve as much smoothing as the BLPF of order 2 for the same value of cutoff frequency.
(a) Original image. (b)-(f) Results ofGaussian low pass filtering with cut off frequencies set at different radii values of 5 15 30 80 and 230
code • % Gaussian Low-Pass Filter • clear all; close all ;clc; • f = imread('test_pattern.tif'); • figure,imshow(f); • PQ = paddedsize(size(f)); • D0 = 230; • H = lpfilter('gaussian',PQ(1), PQ(2), D0); • H1 = fftshift(H); • figure,surf(H1(1:10:PQ(1), 1:10:PQ(2))) • colormap([0 1 0.5]); • axis off • figure,imshow(H1,[]); • g = dftfilt(f, H); • figure, imshow(g, []);
Sharpening Frequency Domain Filters • The edges and abrupt changes in gray levels are associated with high-frequency components. Hence image sharpening can be achieved in the frequency domain by a high pass filtering process, which attenuates the low-frequency components without disturbing high-frequency information in the Fourier transform. This is the reverse operation of the ideal low pass filter. Hence, • Hhp(u,v) = 1 – Hlp(u,v) • Here Hlp(u,v) is the transfer function of the corresponding low pass filter.
Ideal High pass filter (IHPF) • A 2-D ideal high pass filter (IHPF) is defined as: • H(u,v) = 0 if D(u,v) ≤ D0 • = 1 if D(u,v) > D0 • Here D0 is the cutoff distance measured from the origin of the frequency rectangle. This filter is the opposite of the ideal low pass filter. IHPF is not physically realizable with electronic components.