Download
1 / 19
190 likes | 370 Vues
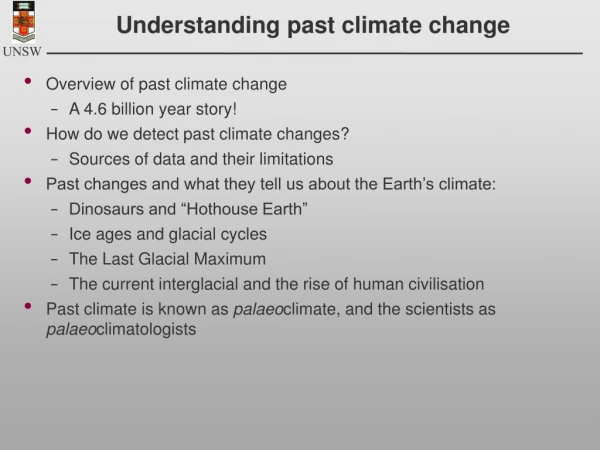
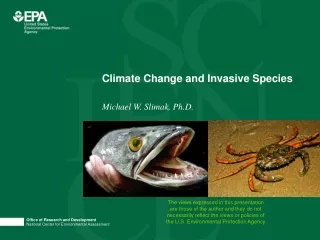
Past Climate Change and Species Responses. Melissa Marquez. There are 4 possible responses of any species to environmental change: Changes in distribution Tolerance Evolution Extinction. Phanerozoic Eon (543 mya to present) . Cenozoic Era (65 mya to today).

E N D
Past Climate Change and Species Responses Melissa Marquez
There are 4 possible responses of any species to environmental change: • Changes in distribution • Tolerance • Evolution • Extinction
Phanerozoic Eon(543 mya to present) Cenozoic Era(65 mya to today) Quaternary (1.8 mya to today)Holocene (10,000 years to today)Pleistocene (1.8 mya to 10,000 yrs)Tertiary (65 to 1.8 mya)Pliocene (5.3 to 1.8 mya)Miocene (23.8 to 5.3 mya)Oligocene (33.7 to 23.8 mya)Eocene (54.8 to 33.7 mya)Paleocene (65 to 54.8 mya) Mesozoic Era(248 to 65 mya) Cretaceous (144 to 65 mya)Jurassic (206 to 144 mya)Triassic (248 to 206 mya) Paleozoic Era(543 to 248 mya) Permian (290 to 248 mya)Carboniferous (354 to 290 mya) Pennsylvanian (323 to 290 mya) Mississippian (354 to 323 mya) Devonian (417 to 354 mya)Silurian (443 to 417 mya)Ordovician (490 to 443 mya)Cambrian (543 to 490 mya)Tommotian (530 to 527 mya) • Evidence from the Cretaceous and the Cenozoic
Change in Distribution • IETM: Initial Eocene Thermal Maximum • At high latitudes there was an increase in the mean annual land temperature ~3 - 4C • Marks Paleocene-Eocene boundary • Plant record shows a gradual change change from typically Paleocene to typically Eocene flora • However, pollen records from the IETM from New Zealand and N.America document little vegetation change? • Problem with Immigration: • Exclusively from south to North and restricted to coastal areas • Consequence of global warming • (Harrington, 2003)
Change in Distribution/Tolerance • Tropical biological Environment • Narrow environmental tolerances • 4 lines of evidence: • Isotopic paleotemperatures • Climate model results • Distribution of climate-sensitive organisms • Quantitative estimates of tropical tolerances
Change in Distribution/Tolerance • Low latitude temperatures • Mid-Cretaceous yield temp. values of 25 to 27C • Surface temperatures of 27 to 32C • Slightly lower temp. than at present • Tropical Temperature Models • GCM simulations • Atmospheric GCMs predict increased tropical sea-surface temperatures for 4x the amount of carbon dioxide. • Models of the NCAR, NOAA and Goddard Institute • Ocean GCMs • A temperature range of 3 to 5C and a salinity range of several parts per thousand are reasonable hypotheses for variation within the tropics during the Mesozoic and Cenozoic
In the geologic record, tropical warming may be the product of changes in carbon dioxide, salinity and by changes in geography. • Case study: • Changes in reef communities • Rudists vs. Corals • Due to increase in tropical warmth and higher salinities • Importance! Climate is a significant limiting factor in the distribution of life • (Barron)
Evolution • Paleocene-Eocene boundary represents a distinct epoch of mammalian evolution • Documented on south side of Polecat Bench and in surrounding badlands of north-western Wyoming • Starting at ca. 55 Ma and lasting ~86 k.y., • during the transition from Paleocene to Eocene epochs and from Clarkforkian to Wasatchian land-mammal ages.
CIE (Paleocene-Eocene thermal maximum): the carbon isotopic excursion • 4-5 mil negative excursion in 13C at the time of the C-W transition • ~2% positive excursion in 18O • 4% negative trend in 18O through much of Clarkforkian and early Wasatchian time • High-Resolution Stratigraphy • Shows the CIE to span the 1500 through 1540 m interval • Duration of ~86,000 yr • High-resolution 18O record in paleosol carbonate showing a ~1% positive excursion consistent with warming
Mammalian Body size across the P-E boundary • Ectocion is one of the more common genera of mammals in strata of Clarkforkian and early Wasatchian age • E. osbornianus • E. parvus • E. parvus was first distinguished from E. osbornianus by its smaller size • Molar size • “Evolutionary Dwarfing” • Another example comes from the Copecion species • C. davisi • C. brachypternus • Perissodactyls • Hyracotherium sandrae • H. grangeri
CIE-PETM interval on land: isotopically light carbon, heavy oxygen temp. elevated by up to 8C and elevated greenhouse gases • Bergmann’s rule • Body size in mammals is also influenced by food quality • “high” CO2 partial pressures (~700ppmv, present-day ~350ppmv), increase photosynthesis, increase C, and decrease N in plant tissues • This would be, simply and directly, environmental selection favoring evolutionary dwarfing • Cause and effect relationship • Discussion: • Species observed following the CIE-PETM event returned to the sizes observed before the event • Climate has an important effect on Cenozoic mammalian faunas
Extinction • Paleocene-Eocene Boundary, ranging between ~57.33 and 58 m.y. ago • 35-50% species reduction in benthic foraminifera, within the genera S. beccariiformis • Benthic values of 18O abruptly decreased by 2%, and about 1.0 to 1.5% in planktonics • Possibly reflects an increase in surface water temps. from 14 to 10C • Values of 13C also decreased by ~2% in the deeper dwelling planktonic and benthic forms and by 4% in surface dwelling • The 4% shift in 13C is the largest so far known for the Cenozoic period • Benthic taxa that survived included Nuttallides truempyi as well as Bulimina semicostata
It is clear that the mass extinction was restricted to the deep-sea biota • The mass extinction coincided with the beginning of the sharp negative shifts in 18O and 13C change • Global warming with strong positive feedback mechanisms • Calculations of rates of sedimentation suggest that the mass extinction occurred in less than about 3000 yr, • the oxygen isotopic shift in less than 4000yr, • and the carbon isotopic shift in less than 6000yr • The Earth was clearly in a “greenhouse” mode • Stott (1992) presented evidence that the Paleocene ocean-atmosphere system was indeed associated with higher levels of CO2 compared to the present time
Discussion ~ What if anything can we learn from these past events? ~ Pros and Cons?