1. Introduction/Purpose
A23C-0318. 2008 AGU Fall Meeting, San Francisco, USA, December 2008. Study on data assimilation of vapor isotope with the ensemble Kalman filter.

1. Introduction/Purpose
E N D
Presentation Transcript
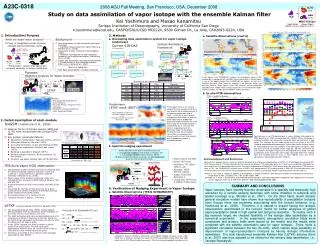
A23C-0318 2008 AGU Fall Meeting, San Francisco, USA, December 2008 Study on data assimilation of vapor isotope with the ensemble Kalman filter Kei Yoshimura and Masao KanamitsuScripps Institution of Oceanography, University of California San Diegok1yoshimura@ucsd.edu, CASPO/SIO/UCSD MC0224, 9500 Gilman Dr., La Jolla, CA92093-0224, USA 1. Introduction/Purpose 3. Methods a. Satellite Observations (cont’d) a. Developing data assimilation system for vapor isotope (underway) TES (800-500mb_dD) SCIAMACHY HDO (Frankenberg et al, in prep.) IsoGSM (800-500mb_dD, collocated) IsoGSM (TPW_dD) In left figures, new SCIAMACHY retrieval for atmospheric column HDO composition is compared with IsoGSM. Strong seasonality in Sahara region is one of the biggest feature that IsoGSM did not capture, as well as in Northern Australia. Also, There are conflicts in the Southern Africa and possibly Amazon. Right figures show TES retrieval and corresponded IsoGSM results. Model shows strong seasonality in Asian Monsoon region, which TES does not show (but SCIAMACY shows somehow). Summary of the expected products and tasks IsoGSM (800-500mb_dD, all the time) b. In-situ FTIR observations FTIR vs IsoGSM at Bremen Ny Alesund The left figure shows a test result of using LETKF to 4 members of GFS’s 6 hour forecast with a single processor at a single time (preparatory step of Task1). In this test, a set of surface and upper air observations all over the world (about total of 20,000 wind speed and temperature data) was used. Even though the ensemble member is unrealistically few, it shows the filter works in expecting way for this preliminary stage. By the time of finishing this task, the assimilation cycle will be run continuously for several months (at least three months) with an appropriate number of ensemble members. Kiruna Bremen FTIR vs IsoGSM at Kiruna 2. Detail description of each module Izana (Similar figure is in Frankenberg et al., in prep.) Data from four in-situ FTIR observatories in various latitudes (Schneider et al., 2006; Notholt et al., 1997) are compared with IsoGSM. When climatology is used from IsoGSM, their seasonality is generally weak (dashed limnes in right figure). This indicates that the model results at the same time as the FTIR should be collocated and compared with, so that more similar seasonal means are calculated (thick lines with triangles in the right figure). Left figures show time series of FTIR and IsoGSM column vapor dD. Not only seasonality, but also variations with higher frequency are well captured in the model. This type of collocation of the model data were simply impossible before the nudging. Note that IsoGSM data for Izana is from 700hPa layer, due to the observatory’s high altitudinal location (2370 m). b. Spectral nudging experiment Acknowledgment and References Yoshimura et al., 2008, JGR We thank Drs. Eugenia Kalnay, Junjie Liu, and Eric Kostelich for assisting the implementation of LETKF; Dr. David Noone for providing TES HDO retrieval data; Dr. Thorsten Warneke for Ny Alesund and Bremen FTS observation data; Drs. Frank Hase and Matthias Schneider for Izana and Kiruna FTS observation data; and Dr. Christian Frankenberg for SCIAMACHY HDO retrieval data. We also thank the TES research team at JPL, the SCIAMACHY research team at NISR, and ground-based FTIR working group at IMK-ASF, Forschungszentrum und Universität Karlsruhe, the Deutsche Forschungsgemeinschaft for funding via the project RISOTO (Geschäftszeichen SCHN 1126/1-1) Notholt, J., G.C. Toon, E. Stordal, S. Solberg, N. Schmidbauer, E. Becker, A. Meier, B. Sen, Seasonal variations of atmosphereic trace gasses in high Arctic at 79N, J. Geophys. Res., 102, 12,855-12,861, 1997. Schneider, M., F. Hase, T. Blumenstock: Ground-based remote sensing of HDO/H2O ratio profiles: introduction and validation of an innovative retrieval approach, ACP, Vol. 6, 4705-4722, SRef-ID: 1680-7324/acp/2006-6-4705, 2006. SUMMARY AND CONCLUSIONS 4. Verification of Nudging Experiment in Vapor Isotope Vapor isotopes have recently become observable in a spatially and temporally high resolution by a remote sensing technique with some limitation in temporal and spatial coverage (e.g., Worden et al., 2007). On the other hand, recent isotopic general circulation models have shown nice reproducibility of precipitation isotopes even though there are problems associating with the chaotic behavior (e.g. Yoshimura et al., 2008). Therefore, it is natural to expect having the isotopic observations assimilated in the isotopic model for better analyses of global vapor/precipitation fields in high spatial and temporal resolution. To realize such a big research target, we checked feasibility of the isotopic data assimilation by a numerical experiment. In the experiment, atmospheric circulation fields were constrained and isotopic fields were leaved by the model, and the results were compared with the satellite observation data for vapor isotopes. There found a significant correlation between the two (R=0.55), which implies large possibility of improvement of vapor/precipitation isotopes by having isotopic information assimilated. The local transformed ensemble Kalman filter (LETKF) scheme (Hunt et al., 2007) was thus adopted to be utilized for the isotopic data assimilation, i.e., “Isotope Reanalysis”. a. Satellite Observations (TES & SCHIAMACHY) Temperature Worden et al., 2007, Nature Humidity Correlation Coef. in different latitudinal regions HDO in Water Vapor R=0.55 Comparison between TES/Aura observation and IsoGSM nudging simulation results (Y08). Violet lines in left figures indicate time sequences of TES observations during 20-21 Sep. 2004, which consist of 31 different orbital movements. Pink lines are corresponded simulation results.