Download

1 / 129
1.3k likes | 1.78k Vues
Theories of Business Cycles. Junhui Qian. Content. Overview Sticky Price The Keynesian Cross The IS-LM Model The Aggregate Demand Model The Mundell -Fleming Model Theory of Aggregate Supply A Dynamic AD-AS Model. Business Cycle.

E N D
Theories of Business Cycles Junhui Qian Intermediate Macroeconomics
Content • Overview • Sticky Price • The Keynesian Cross • The IS-LM Model • The Aggregate Demand Model • The Mundell-Fleming Model • Theory of Aggregate Supply • A Dynamic AD-AS Model Intermediate Macroeconomics
Business Cycle • The business cycle is the upward and downward movement of output around the long-term trend. • The business cycle is most often measured in terms of the growth rate of real GDP. Intermediate Macroeconomics
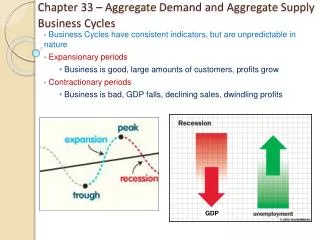
A Stylized Business Cycle Real Growth Rate Peak Peak Trough Recession Expansion Intermediate Macroeconomics
Macroeconomic Fluctuations: China Intermediate Macroeconomics
Macroeconomic Fluctuations: China Intermediate Macroeconomics
Macroeconomic Fluctuations: China Intermediate Macroeconomics
Macroeconomic Fluctuations: US Intermediate Macroeconomics
Some Facts About Business Cycle • The growth rate is persistent: High growth often follows high growth. • Expansion is often long and recession is often short-lived. • Growth in consumption is less volatile than that in investment. • The labor market moves, albeit imperfectly, with the business cycles. • Okun’s Law: Intermediate Macroeconomics
Identifying Recessions • In the United States, the official arbiter of when recessions begin and end is the NBER (National Bureau of Economic Research), a nonprofit economic research group. • The old rule of thumb: a recession is a period of at least two consecutive quarters of declining real GDP. • However, the NBER does not follow any fixed rule but use discretion in identifying recessions. Intermediate Macroeconomics
Forecasting Business Cycles • Economists rely on empirical models and leading indicators to forecast business cycles. • Most often, forecasts differ because economists use different models and different indicators. • A well-known leading indicator is the Conference Board Leading Economic Index, which compiles 10 time series (themselves leading indicators) into an index for various regions in the world. • Average workweek of production workers in manufacturing. • Average initial weekly claims for unemployment insurance. • New orders for consumer goods and materials, adjusted for inflation. • New orders for nondefense capital goods. • Index of supplier deliveries. • New building permits issued. • Index of stock prices. • Money supply (M2), adjusted for inflation. • Interest rate spread: the yield spread between 10-year Treasury notes and 3-month Treasury bills. • Index of consumer expectations. Intermediate Macroeconomics
The Conference Board Leading Economic Index Intermediate Macroeconomics
Content • Overview • Sticky Price • The Keynesian Cross • The IS-LM Model • The Aggregate Demand Model • The Mundell-Fleming Model • Theory of Aggregate Supply • A Dynamic AD-AS Model Intermediate Macroeconomics
Time Horizons in Macroeconomics • Long run: Prices are flexible, responding to changes in supply or demand. • Short run: Many prices are “sticky” at some predetermined level. • In classical macroeconomic theory, output is determined by the supply side and changes in the demand side affects only prices. Hence price flexibility is a crucial assumption, which is only reasonable in the long run. • When prices are sticky, output and employment also depend on the demand. Intermediate Macroeconomics
Theories of Price Stickiness • Coordination failure: 60.6% (percentage of managers who accept) • Firms hold back on price changes, waiting for others to go first • Cost-based pricing with lags: 55.5% • Price increases are delayed until costs rise • Delivery lags, service, etc.: 54.8% • Firms prefer to vary other product attributes, such as delivery lags, service, or product quality • Implicit contracts: 50.4% • Firms tacitly agree to stabilize prices, perhaps out of “fairness” to customers • Nominal contracts: 35.7% • Prices are fixed by explicit contracts Source: A.S. Blinder, 1994, “On sticky prices: academic theories meet the real world”, in N.G. Mankiw, ed., Monetary Policy, University of ChicagoPress, 117-154.
Policy Implications of Sticky Prices • When prices are sticky, output and employment depend on the demand. • The demand can be influenced by many factors, including, among others, • consumer and investor confidence, which can be very volatile, • monetary and fiscal policies. • Hence monetary and fiscal policies may be useful in stabilizing the economy in the short run. Intermediate Macroeconomics
Content • Overview • Sticky Price • The Keynesian Cross • The IS-LM Model • The Aggregate Demand Model • The Mundell-Fleming Model • Theory of Aggregate Supply • A Dynamic AD-AS Model Intermediate Macroeconomics
The Keynesian Cross • We assume that the planned expenditure is the sum of planned consumption, planned investment and planned government purchase, where the tax (), investment (), and the government purchase () are exogenously fixed. • In equilibrium, the planned expenditure has to be equal to the actual expenditure (), • If the actual expenditure exceeds the planned expenditure, the inventory would be lower. This would induce firms to produce more. If the actual expenditure is lower than the planned, the inventory accumulation would induce firms to produce less. • If the consumption function is linear, e.g., , then the right-hand-side is a straight line with slope , while the left-hand-side is a 45 degree line. Intermediate Macroeconomics
The Keynesian Cross Expenditure Actual expenditure Equilibrium Planned expenditure Equilibrium income Total income/output Intermediate Macroeconomics
The Effect of Fiscal Stimulus Expenditure An increase in government spending: Increase in income/out Total income/output Intermediate Macroeconomics
The Government Purchase Multiplier • Assume that the consumption function is linear, , where is often called autonomous consumptionand is called the marginal propensity consume (MPC). • Take partial differentiation of the following equation with respect to G, which yields • is called the government purchase multiplier. • Similarly, an increase in also leads to the same multiplication effect in . Intermediate Macroeconomics
The Tax Multiplier • Similarly, we obtain • is called the tax multiplier. Intermediate Macroeconomics
The Limitation of Keynesian Cross • The investment is assumed to be exogenously given. The assumption is not realistic, since investment tends to depend on, among other factors, financing cost measured by interest rate, which is endogenously determined in the financial market. • Treating investment as exogenous results in an over-estimated multiplier effect, since “crowding-out” is ruled out. • We now present the IS-LM model that endogenizes investment, which explicitly depends on interest rate . Intermediate Macroeconomics
Content • Overview • Sticky Price • The Keynesian Cross • The IS-LM Model • The Aggregate Demand Model • The Mundell-Fleming Model • Theory of Aggregate Supply • A Dynamic AD-AS Model Intermediate Macroeconomics
Overview of IS-LM • IS stands for “investment” and “saving”. • LM stands for “liquidity” and “money”. • The IS-LM model consists two equations that describe the financial market (IS, or equivalently the market for goods and services) and the money market (LM). • The IS-LM model is the leading interpretation of John Maynard Keynes’s theory, which was developed in the depth of the Great Depression. Intermediate Macroeconomics
The IS Equation • Assume that investment is a function of the interest rate, • We assume that is differentiable and . That is, higher interest rate increases the borrowing cost, hence lowers the level of investment in the economy. • The IS equation is given by • As we have learned previously, the IS equation characterizes the financial market (or goods market) equilibrium and defines an implicit function of or , the IS curve. Intermediate Macroeconomics
The IS Curve • Since is a decreasing function, a decline in results in higher investment, which leads further to higher . Hence is downward sloping. • Using the implicit function theorem, we obtain the slope of the IS curve, IS Intermediate Macroeconomics
The Effect of Fiscal Policy • Given an interest rate , the Keynesian Cross analysis tells us that an increase in brings in . • This implies that a -increase in government purchase would shift the IS curve to the right by . IS’’ IS’ Intermediate Macroeconomics
The LM Equation • The LM equation characterizes the money market equilibrium (Liquidity demand = Money supply), • is the money supply, which is assumed to be exogenously given. (Imagine that the monetary authority controls .) • is the price level, which is assumed to be fixed in the short term. • is decreasing in and increasing in . • Like the IS equation, the LM equation also defines an implicit function of or , the LM curve. • The LM equation theorizes Keynes’ view of how interest rate is determined. It was called the theory of liquidity preference. Intermediate Macroeconomics
The LM Curve • Given and , for the LM equation to hold, a decline in must be accompanied by a decline in . • Intuition: a decline in income reduces demand for money. Given the fixed money supply, the interest rate declines. • Hence the LM curve is an upward-sloping curve. LM Intermediate Macroeconomics
Moving Along The LM Curve • Points on an LM curve are all consistent with equilibrium in the money market, given the money supply and price level • A change in or would result in movement along the LM. • Using the implicit function theorem, we obtain the slope of the LM curve, • If , the LM curve is horizontal (liquidity trap). • If , the LM curve is vertical (quantity theory of money). Intermediate Macroeconomics
How Monetary Policy Shifts the LM Curve • An exogenous change in or would shift the LM curve. • In particular, if the monetary authority increases , then the LM curve would shift rightward. LM’ LM’’ Monetary expansion Intermediate Macroeconomics
The IS-LM Model • The IS-LM model is composed of two equations characterizing goods and money markets, respectively, • The equilibrium of the economy is the solution to the above two equations, i.e., the point at which the IS curve and the LM curve cross. Intermediate Macroeconomics
The IS-LM Curves Interest rate, LM Equilibrium interest rate Equilibrium output IS Output, Y Intermediate Macroeconomics
Explain Business Cycles: From Overheat to Crash • When the economy overheats, optimistic investors over-leverage, and asset prices deviates substantially from what fundamentals can support. • The asset prices crash due to some bad news (e.g., failure of a major bank, credit tightening, etc.). • Less wealth (consumption) for households • Higher (equity or bond) financing costs for business investment. • A lost of investment and consumption confidence. • All these shift the IS curve to the left • As businesses and households start repaying debt, money supply shrinks. • If the monetary authority does not act quickly enough, the real money supply may decline, shifting the LM curve to the left. • The real interest rate may increase, putting more stress on debtors and the price level. • Aggregate demand declines • Disinflation or even deflation occurs. • Unemployment rises, further reducing aggregate demand. Intermediate Macroeconomics
Explain Business Cycles: From Bottom to Expansion • The government would eventually intervene. • The monetary authority may cut interest rate and expand money supply, shifting the LM curve to the right. • The fiscal authority may reduce tax rate and increase government spending, shifting the IS curve to the right. • As the consumer and investor sentiment gradually improve, households and companies start to spend money on consumption and investment goods again. These spending create more income for other households and companies, starting a virtuous cycle. • The economy continues to expand and people use higher and higher leverage, paving way for the next round of boom-and-bust. Intermediate Macroeconomics
Explaining the Great Depression Intermediate Macroeconomics
The Spending Hypothesis: Shocks to the IS Curve • An exogenous fall in spending on goods and services, which shifts the IS curve to the left. • The stock market crash of 1929 • The end of residential investment boom • Once the Depression started, more negative shocks came: • Bank failures in the early 1930s • Fiscal tightening to rein in budget deficit. Intermediate Macroeconomics
The Monetary Hypothesis: Shocks to the LM Curve • Along this vein of argument, the contraction of money supply was blamed for the Depression. • However, there are two problems with the argument: • The real money balance actually increased from 1929 to 1931. • The nominal interest rate declined continuously from 1929 to 1933. However, the real interest rate increased in the same period. Intermediate Macroeconomics
The Monetary Hypothesis: The Effects of Deflation • Deflation is defined as a fall in the general price level. • Deflation was thought to be good for the economy: • A fall in price expands the real money supply. • The Pigou effect: a fall in price brings about an increase in the purchasing power of the money balance held by households. The households feel wealthier and spend more, shifting the IS to the right. • However, deflation seems more effective in depressing income: • The debt-deflation theory • The role of expected deflation Intermediate Macroeconomics
The Debt-Deflation Theory • Assume that debtors (those who borrow money) have higher propensity to consume than creditors do. • Deflation increases debt burden, shifting purchasing power from debtors to creditors. • Under our assumption, the reduction of spending by the debtors is more than the increase of spending by the creditors. The net effect is a reduction of spending, shifting the IS curve to the left. Intermediate Macroeconomics
The Role of Expectation • Consider the following modified IS-LM equations: • If investors expect deflation, that is, then the IS curve immediately shifts to the left. Intermediate Macroeconomics
Policy Responses to Recessions • Policy makers may use fiscal, monetary, and both, to increase aggregate demand. • Fiscal stimulus • Increase in government purchasing • Tax reduction • Monetary stimulus • Combination of fiscal and monetary policies Intermediate Macroeconomics
Policy Analysis • Holding fixed, we take total differentiation of the IS-LM equations and obtain • Using the Cramer’s, we can obtain: • The effect of increasing government purchases on income and interest rate: and • The effect of tax reduction on income and interest rate: and • The effect of expansionary monetary policy on income and interest rate: and . Intermediate Macroeconomics
The Effect of Fiscal Policies • Holding fixed (that is,). Using the Cramer’s Rule, we obtain • The effect of fiscal policies can be summarized as follows, • The effect of government purchase on output: • The effect of government purchase on interest rate: • The effect of tax on output: • The effect of tax on interest rate: Intermediate Macroeconomics
The Effect of Monetary Policies • Similarly, holding and fixed, we obtain • Expansionary monetary policy (e.g., QE) would result in lower interest rate and higher output (income). Intermediate Macroeconomics
The Effect of Expansionary Fiscal and Monetary Policies Monetary expansion LM’ LM’’ IS Fiscal stimulus LM IS’’ IS’ Intermediate Macroeconomics
When Monetary Policy Becomes Ineffective: Liquidity Trap • Liquidity trap refers to the situation that increase in money supply fails to lower interest rate. • When nominal interest rate reaches zero. • When (The LM curve is horizontal) • In a liquidity trap, monetary policy is ineffective . This was the position Keynesians took during the Great Depression, the Japanese “Lost Decade”, and to a lesser degree, the recent global financial crisis. • In contrast, fiscal policy is effective and exhibits the multiplier effects in the Keynesian Cross model: and . Intermediate Macroeconomics
When Fiscal Policy Becomes Ineffective • When (classical quantity theory of money), the LM curve is vertical, fiscal policies become ineffective. • Only monetary policy matters in this case. This was the position that the Monetarists took (e.g., Milton Friedman) during the “stagflation” in the 1970s. Intermediate Macroeconomics