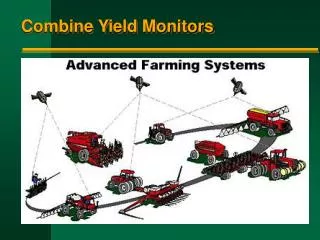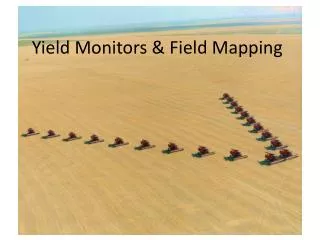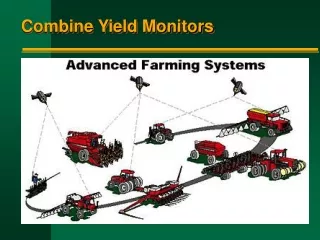
Combine Yield Monitors
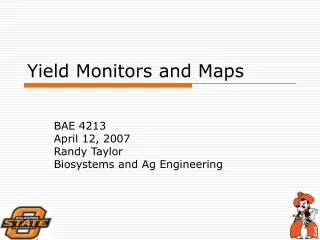
Combine Yield Monitors. Current Yield Monitors. Mass-flow sensor Volumetric-flow sensor Conveyor belt load sensor Trailer load sensor Torque transducer. Basics of Yield Monitoring. Possible Crops to Monitor Wheat and other grains Cotton Potato and Sugar Beets Beans Rice


Combine Yield Monitors
E N D
Presentation Transcript
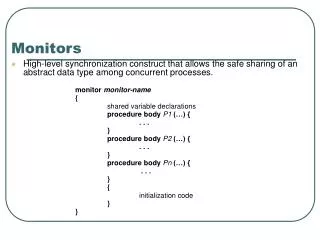
Current Yield Monitors • Mass-flow sensor • Volumetric-flow sensor • Conveyor belt load sensor • Trailer load sensor • Torque transducer
Basics of Yield Monitoring • Possible Crops to Monitor • Wheat and other grains • Cotton • Potato and Sugar Beets • Beans • Rice • Specialty Crops • Grapes, Tomatoes, Carrots, etc.
Impulse Yield Sensors Micro Trak John Deere Case Ag Leader
Non-Impulse Yield Sensors Nuclear - Massey Ferguson - Europe High Frequency Radio Waves New Holland - Not marketed
Capacitance Moisture Sensors Micro Track John Deere Ag Leader Case
Yield Mapping Trailer • Measures change in weight in the trailer while allowing for comparison at different times. • Can be used for any crop that is loaded into a trailer continuously while harvested.
Corn Silage • The drive shaft of the base unit powering the cutterhead, feedrolls, and front attachment, are instrumented with strain gauge torque transducers. • Cutting power is linearly related to material feedrate. • Material flow can be expressed as: • Fr(t)=Yi(t)Sp(t)W
Sources of Yield Map Error • Unknown swath width • Time lag of grain through combine • GPS error • Multiple paths through combine • Surging of grain through combine • Grain losses • Sensor Calibration
Sources of Impulse Yield Sensor Error • Grain Moisture • Grain Test Weight • Grain Temperature • Grain Cultivar • Grain Species • Contamination • Dirt • Plant oils, sap, etc.
Effect of Lag Time on Combine Yield Measurements Crop Yield Along Swath Actual Grain Yield Yield t P t0 Yield Yield Monitor Measured Grain Yield P t
Yield Monitor 26.4 bu/ac Satellite Estimate 28.7 bu/ac Combine Yield Monitor and Satellite Estimated Wheat Yield Maps
GPS Error in Corn – Loss of Differential Correction Signal Oklahoma Panhandle, 1998
Two Combines in the Field with only One Equipped with GPS Oklahoma Panhandle, 1997
Corn Yield Surface with Krieging Oklahoma Panhandle, 1997
Corn Yield Surface with Krieging Oklahoma Panhandle, 1998
Wheat Yield Under a Center Pivot Irrigation System Oklahoma Panhandle, 1998
Wheat Yield Under a Center Pivot Irrigation System Oklahoma Panhandle, 1997
Wheat Yield Under a Center Pivot Irrigation System Oklahoma Panhandle, 1997
Wheat Yield Under a Center Pivot Irrigation System Oklahoma Panhandle, 1998
Southwest Iowa Corn Field Yield Moisture
AgLeader Cotton Yield Monitor Developed by John Wilkerson – University of Tennessee
5 Class Krieg Lime Streaking Yield Map NDVI Map Lime Streaking not evident Courtesy of Tim Sharp Jackson State C.C.
5 Class Krieg NDVI surface With lime streaking Yield Surface With Lime Streaking Courtesy of Tim Sharp Jackson State C.C.
Fertilizer Streaking 5 Class Krieg Spinner Applicator Yield Surface NDVI Surface Courtesy of Tim Sharp Jackson State C.C.
Major Challenge • Correlate NDVI surface data with yield surface data Courtesy of Tim Sharp Jackson State C.C.
Cotman Sample Points Low Medium High Courtesy of Tim Sharp Jackson State C.C.
NDVI 5 Class Surface of Cotton Note Image of Surrounding Fields, they were Top-dressed with A spreader buggy By the grower Red is Bad Green is Good Severe Streaking Courtesy of Tim Sharp Jackson State C.C.
Green, Red, NIR image Composite 5 Class NDVI with Fertilizer streaking Courtesy of Tim Sharp Jackson State C.C.