Download
1 / 67
670 likes | 788 Vues
This report analyzes health insurance coverage trends among nonelderly Americans in 2010, revealing that approximately 305.2 million individuals were covered, with a significant percentage insured through employer-sponsored programs. The data highlights rising uninsured rates, particularly among low-income families, and examines barriers to healthcare access based on insurance status. Key variables include family income, employment status, and demographic factors impacting health coverage. Insights derived from sources such as the Census Bureau and the Kaiser Family Foundation underscore the ongoing challenges faced by uninsured populations.

E N D
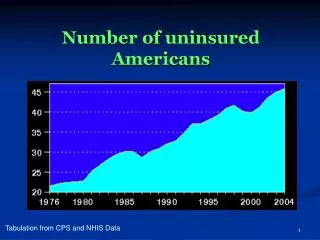
Number of uninsured Americans Tabulation from CPS and NHIS Data
Health Insurance Coverage in the U.S., 2010 Total = 305.2 million * Medicaid also includes other public programs: CHIP, other state programs, military-related coverage. Numbers may not add to 100 due to rounding.SOURCE: KCMU/Urban Institute analysis of 2011 ASEC Supplement to the CPS.
Health Insurance Coverage ofthe Nonelderly Population, 2010 Private Non-group 5.5% 266.0 Million SOURCE: KCMU/Urban Institute analysis of 2011 ASEC Supplement to the CPS.
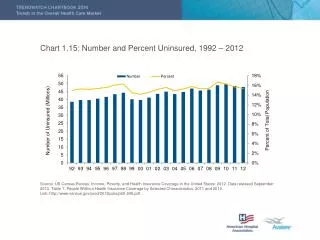
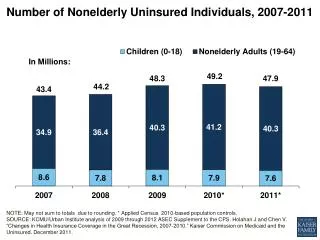
Number of Nonelderly Uninsured Americans, 2004 – 2010 SOURCE: DeNavas-Walt C, Proctor B, and Smith J. “Income, Poverty, and Health Insurance Coverage in the United States: 2010”. United States Census Bureau. Issued September 2011.
Number of Nonelderly Americans with Employer Sponsored Insurance, 2000 – 2007 Millions Percent of Nonelderly Americans: * The Census Bureau periodically revises its CPS methods, which means data before and after the revision are not comparable. Comparison across years can be made between 2000 through 2004, and 2004 though 2007. Source: Kaiser Commission on Medicaid and the Uninsured/Urban Institute analysis of 2001-2008 ASEC Supplements to the CPS.
Access to Insurance through the Workplace by Income, 2005 Percent of employees not offered insurance through own or spouse’s employer Percent of Federal Poverty Level Source: Urban Institute analysis of the February and March 2005 CPS Supplements, 2006, for the Kaiser Commission on Medicaid and the Uninsured.
Adults’ Health Insurance Coverage by Family Poverty Level, 2010 Number 400% + 68.6 M 50.7 M 200-399% 100-199% 31.6 M Under 100% 35.8 M NOTES: The Federal Poverty Level for a family of four in 2010 was $22,050. Adults includes all individuals aged 19-64. Data may not total 100% due to rounding. SOURCE: KCMU/Urban Institute analysis of 2011 ASEC Supplement to the CPS.
Barriers to Health Care Among Nonelderly Adults, by Insurance Status, 2009 Percent of adults (age 18 – 64) reporting: * In past 12 months.Respondents who said usual source of care was the emergency room were included among those not having a usual source of care.SOURCE: KCMU analysis of 2009 NHIS data.
Dental Coverage and Use Among Non-Elderly Adults, 2005 Percent of Low-Income with Dental Check-Up in Last Year Percent With Dental Coverage 64% 50% 42%* 17%* Higher-Income Low-Income Insured, w/ Dental Coverage Uninsured Source: 2005 Kaiser Low-Income Coverage and Access Survey. Notes: Low-income is defined as living in families earning 200% of the federal poverty level (FPL) or less who live in high-poverty Census tracts. Adults are those age 19-64. Dental coverage includes both private and public sources. * Indicates statistically significant difference at the p<.05 level.
Diagnosis of Late-Stage CancerUninsured vs. Privately Insured Ratio of probability of diagnosis of late vs. early stage cancer, Uninsured/private insurance Equal likelihood between Uninsured and Insured NOTE: Odds ratios were adjusted for age, sex, race/ethnicity, facility type, region, and income and education on basis of postal code. They represent the odds of being diagnosed with stage III or state IV cancer vs. stage I cancer. Analysis based on cases occurring between 1998-2004. SOURCE: Kaiser Family Foundation, based on Halpern MT et al, Association of insurance status and ethnicity with cancer stage at diagnosis for 12 cancer sites: a retrospective analysis." The Lancet Oncology. March 2008.
Financial Consequences of Medical Bills by Insurance Status, 2009 Percent of adults (age 18-64) reporting in past 12 months: NOTE: All differences between insured and uninsured are statistically significant (p<0.05).SOURCE: Kaiser Family Foundation Health Tracking Poll: August 2009.
Impact of the Rise in Unemployment on Health Coverage, 2008 to 2009 3.0 2.8 Decrease in Employer Sponsored Insurance (million) = & 2.8% National Unemployment Rate Increase since 2008 (from 7.2% in Dec-08 to 10.0% in Nov-09) Medicaid /CHIP Enrollment Increase (million) Uninsured Increase (million) 6.9 Note: Totals may not sum due to rounding and other coverage. Source: Based on John Holahan and Bowen Garrett, Rising Unemployment, Medicaid, and the Uninsured, prepared for the Kaiser Commission on Medicaid and the Uninsured, January 2009.
Characteristics of the Nonelderly Uninsured, 2010 The federal poverty level was $22,050 for a family of four in 2010. Data may not total 100% due to rounding. SOURCE: KCMU/Urban Institute analysis of 2011 ASEC Supplement to the CPS. Family Income Family Work Status Family Status 400% FPL and Above 251-399% FPL No Workers Children Adults without Dependent Children <100% FPL 1 or More Full-Time Workers Parents 100-250% FPL Part-Time Workers Total = 49.1 million uninsured
Nonelderly’s Health Insurance Coverage by Family Work Status, 2010 Number 39.5 M 24.9 M 136.0 M 65.7 M No workers Only part time One full-timeworker Two full-time workers NOTES: Data may not total 100% due to rounding. SOURCE: KCMU/Urban Institute analysis of 2011 ASEC Supplement to the CPS.
Uninsured Rates Among Nonelderly by State, 2009-2010 NH VT WA ME MT ND MN MA OR NY WI SD ID RI MI CT WY PA NJ IA NE OH NV IN IL DE UT WV VA MD CO CA KS MO KY DC NC TN OK SC AR AZ NM GA AL MS AK TX LA FL HI <14% Uninsured (13 states & DC) National Average = 18.4% 14 to 18% Uninsured (18 states) >18% Uninsured (19 states) SOURCE: KCMU/Urban Institute analysis of 2010 and 2011 ASEC Supplement to the CPS (two-year pooled data). In 2011, the Census Bureau adjusted the imputation methodology for variables related to insurance coverage but has not yet released detailed revised data for previous years. This map applies methodology to replicate the Census’s revision.
Nonelderly’s Health Insurance Coverage by Age Group, 2009 Number 35.4 M 55 - 64 44.3 M 45 - 54 40.2 M 35 - 44 40.7 M 25 - 34 19 - 24 24.8 M Under 19 79.3 M NOTES: Data may not total 100% due to rounding. SOURCE: Kaiser Commission on Medicaid and the Uninsured/Urban Institute analysis of 2010 ASEC Supplement to the CPS.
Nonelderly’s Health Insurance Coverage by Race and Ethnicity, 2009 Private Medicaid/Public Uninsured Number 4.4 M Multiracial 1.8 M American Indian 12.9 M Asian 33.5 M Black 46.0 M Hispanic White 166.0 M NOTES: Data may not total 100% due to rounding. American Indian category includes Aleutian Eskimos. Asian includes South Pacific Islander.SOURCE: Kaiser Commission on Medicaid and the Uninsured/Urban Institute analysis of 2010 ASEC Supplement to the CPS.
Nonelderly’s Health Insurance Coverage by Citizenship Status, 2009 Number Non-citizen0-4 years 4.1 M Non-citizen5 years or more 16.1 M 244.6 M U.S. citizen SOURCE: Kaiser Commission on Medicaid and the Uninsured/Urban Institute analysis of 2010 ASEC Supplement to the CPS.
Health Insurance Coverage ofChildren, 2010 79.3 Million Children NOTES: Data may not total 100% due to rounding. Children includes all individuals under age 19. SOURCE: KCMU/Urban Institute analysis of 2011 ASEC Supplement to the CPS.
Children’s Health Insurance Coverage by Family Poverty Level, 2010 Number 400% + 20.2 M 200% - 399% 21.2 M 100% - 199% 15.8 M Under 100% 22.0 M NOTES: The Federal Poverty Level for a family of four in 2010 was $22,050 (according to the U.S. Census Bureau’s poverty threshold). Children includes all individuals under age 19.SOURCE: KCMU/Urban Institute analysis of 2011 ASEC Supplement to the CPS.
Uninsured Rates for Children under 19, by State, 2008-2009 NH VT WA ME MT ND MN MA OR NY SD WI ID RI MI CT WY PA NJ IA NE OH IN DE NV IL WV UT MD VA CO KY CA KS MO NC DC TN OK SC AR AZ NM GA MS AL TX LA AK FL HI < 9% (25 states and DC) 9-12% (17 states) US Average = 10.4% > 12% (8 states) NOTES: Children includes all individuals under age 19.SOURCE: Kaiser Commission on Medicaid and the Uninsured/Urban Institute analysis of 2009 and 2010 ASEC Supplements to the CPS. Two-year pooled estimates for states and the US (2008-2009).
Health Insurance Coverage ofNonelderly Adults, 2009 185.4 Million Nonelderly Adults NOTES: Adults includes all individuals aged 19 to 64. SOURCE: Kaiser Commission on Medicaid and the Uninsured/Urban Institute analysis of 2010 ASEC Supplement to the CPS.
Adults’ Health Insurance Coverage by Family Poverty Level, 2009 Number 400% + 68.4 M 51.8 M 200-399% 100-199% 31.1 M Under 100% 34.1 M NOTES: The Federal Poverty Level for a family of four in 2009 was $22,050. Family size and total family income are grouped by insurance eligibility. Adults includes all individuals aged 19-64. Data may not total 100% due to rounding. SOURCE: Kaiser Commission on Medicaid and the Uninsured/Urban Institute analysis of 2010 ASEC Supplement to the CPS.
Adults' Health Insurance Coverage by Family Work Status, 2009 Number 26.1 M No workers 17.8 M Only part-time One full-timeworker 94.9 M Two full-time workers 46.7 M NOTES: Adults includes all individuals aged 19 to 64. SOURCE: Kaiser Commission on Medicaid and the Uninsured/Urban Institute analysis of 2010 ASEC Supplement to the CPS.
Adults' Health Insurance Coverage by Education, 2009 Number College graduate 53.6 M Some college 55.0 M High school graduate 55.9 M Less thanhigh school 20.9 M NOTES: “Some college” category includes respondents with an associate’s degree. Adults includes all individuals aged 19 to 64. Data may not total 100% due to rounding. SOURCE: Kaiser Commission on Medicaid and the Uninsured/Urban Institute analysis of 2010 ASEC Supplement to the CPS.
Adults' Health Insurance Coverage by Age Group, 2009 Number 55 - 64 35.4 M 40 - 54 64.8 M 30 - 39 39.2 M 21.2 M 25 - 29 24.8 M 19 - 24 NOTES: Adults includes all individuals aged 19 to 64. Data may not total 100% due to rounding.SOURCE: Kaiser Commission on Medicaid and the Uninsured/Urban Institute analysis of 2010 ASEC Supplement to the CPS.
Health Insurance Coverage ofWorkers, 2009 144.3 Million Workers NOTES: Workers includes all workers aged 18-64. SOURCE: Kaiser Commission on Medicaid and the Uninsured/Urban Institute analysis of 2010 ASEC Supplement to the CPS.
Workers’ Health Insurance Coverage by Family Poverty Level, 2009 Number 62.1 M 400% + 44.4 M 200% - 399% 23.3 M 100% - 199% Under 100% 14.5 M NOTES: The Federal Poverty Level for a family of four in 2009 was $22,050. Family size and total family income are grouped by insurance eligibility. Workers includes all workers aged 18-64. SOURCE: Kaiser Commission on Medicaid and the Uninsured/Urban Institute analysis of 2010 ASEC Supplement to the CPS.
Workers' Health Insurance Coverage by Age Group, 2009 Number 23.8 M 55 - 64 35.7 M 45 - 54 35 - 44 32.9 M 25 - 34 33.2 M 18 - 24 18.8 M NOTES: Workers includes all workers aged 18-64. Data may not total 100% due to rounding. SOURCE: Kaiser Commission on Medicaid and the Uninsured/Urban Institute analysis of 2010 ASEC Supplement to the CPS.
Workers' Health Insurance Coverage by Education, 2009 Number College graduate 46.0 M Some college 43.2 M High school graduate 41.9 M Less thanhigh school 13.3 M NOTES: Some college category includes respondents with an associate’s degree. Workers includes all workers aged 18-64. Data may not total 100% due to rounding.SOURCE: Kaiser Commission on Medicaid and the Uninsured/Urban Institute analysis of 2010 ASEC Supplement to the CPS.
Workers' Health Insurance Coverage by Firm Size, 2009 Number Firm Size Public Sector 21.8 M 1,000 + 41.6 M 100 - 999 21.8 M 25 - 99 16.6 M 29.8 M <25 Self employed 12.9 M NOTES: Workers includes all workers aged 18-64. Self-employed includes only self-employed in firms with less than 25 workers. Of the self-employed with private coverage, 86% work in firms with less than 10 employees. SOURCE: Kaiser Commission on Medicaid and the Uninsured/Urban Institute analysis of 2010 ASEC Supplement to the CPS.
Workers' Health Insurance Coverage by Occupation, 2009 Number 89.6 M Blue collar White collar 54.7 M NOTES: Workers includes all workers aged 18-64. SOURCE: Kaiser Commission on Medicaid and the Uninsured/Urban Institute analysis of 2010 ASEC Supplement to the CPS.
Workers' Health Insurance Coverage by Industry, 2010 Mining/ manufacturing Health/ social services Utilities, transportation Number Public admin. 6.9 M Information/ education 17.1 M Finance 9.5 M 15.5 M 18.9 M 7.3 M 15.6 M Professions Wholesale and 20.6 M retail trade Construction 10.9 M Services 19.8 M 2.2 M Agriculture NOTES: Data may not total 100% due to rounding. Workers includes all workers aged 18-64. “Information/Education” category includes communications. “Services” includes arts and entertainment.SOURCE: Kaiser Commission on Medicaid and the Uninsured/Urban Institute analysis of 2010 ASEC Supplement to the CPS.
Uninsured Rates Among Selected Industry Groups, White vs. Blue Collar Jobs, 2009 Information/Education/ Communication (12% of jobs) Health/Soc Services (13%) Mining/Manufacturing (11%) Services/Arts Entertainment (14%) Wholesale/Retail (14%) Uninsured Rate for All Workers = 20% NOTES: Workers includes all workers aged 18-64. White collar workers include all professionals and managers; all other workers classified as blue collar. SOURCE: Kaiser Commission on Medicaid and the Uninsured/Urban Institute analysis of 2010 ASEC Supplement to the CPS.
Medicaid Has Many Vital Roles In Our Health Care System Health Insurance Coverage 31 million children & 16 million adults in low-income families; 16 million elderly and persons with disabilities Assistance to Medicare Beneficiaries 9.4 million aged and disabled — 20% of Medicare beneficiaries Long-Term Care Assistance 1.6 million institutional residents; 2.8 million community-based residents MEDICAID Support for Health Care System and Safety-net 16% of national health spending; 40% of long-term care services State Capacity for Health Coverage Federal share can range from 50 - 83%; For FFY 2012, ranges from 50 - 74.2%
Medicaid Enrollees and Expenditures, FY 2009 NOTE: Percentages may not add up to 100 due to rounding. SOURCE: KCMU/Urban Institute estimates based on data from FY 2009 MSIS and CMS-64, 2012.MSIS FY 2008 data were used for MA, PA, UT, and WI, but adjusted to 2009 CMS-64. Total = 62.6 million Total = $346.5 billion
Top 5% of Enrollees Accounted for More than Half of Medicaid Spending, FY 2009 SOURCE: KCMU/Urban Institute estimates based on data from FY 2009 MSIS and CMS-64, 2012.MSIS FY 2008 data were used for MA, PA, UT, and WI, but adjusted to 2009 CMS-64. Bottom 95% of Spenders Top 5% Bottom 95% of Spenders Children 3.7% Adults 1.9% Top 5% 55% Disabled 30.4% Children 0.3% Adults 0.2% 5% Disabled 2.5% Elderly 18.6% Elderly 2.0% Total = 62.6 million Total = $346.5 billion
Medicaid Payments Per Enrollee by Acute and Long-Term Care, 2009 NOTE: Totals may not sum due to rounding. SOURCE: Kaiser Commission on Medicaid and the Uninsured and Urban Institute estimates based on FY 2009 MSIS and CMS-64 data. $15,453 $13,186 $2,926 $2,313 $13 $65
Medicaid Enrollees are Sicker and More Disabled Than the Privately-Insured Note: Adults 19-64. SOURCE: KCMU analysis of MEPS 3-year pooled data, 2004-2006. Poor (<100% FPL) Near Poor (100-199% FPL)
Medicaid in the Health System, 2008 Medicaid as a share of national health care spending: Total National Spending (billions) $2,181 $718 $731 $138 $234 Note: Does not include spending on CHIP. SOURCE: Centers for Medicare and Medicaid Services, Office of the Actuary, National Health Statistics Group, National Health Expenditure Accounts, January 2010.
Medicaid Expenditures by Service, 2010 NOTE: Total may not add to 100% due to rounding. Excludes administrative spending, adjustments and payments to the territories. SOURCE: Urban Institute estimates based on data from CMS (Form 64), prepared for the Kaiser Commission on Medicaid and the Uninsured. DSH Payments 4.5% Inpatient 13.6% Home Health and Personal Care 14.1% Physician/ Lab/ X-ray 3.7% Mental Health 0.9% Outpatient/Clinic 6.7% Acute Care 64.0% ICF/MR 3.5% Long-Term Care 31.5% Drugs 4.1% Nursing Facilities 13.0% Other Acute 9.6% Payments to Medicare 3.5% Payments to MCOs 22.8% Total = $389.1 billion
Growth in Medicaid Long-Term Care Services Expenditures, FFY 1990-2009 Note: Home and community-based care includes home health, personal care services and home and community-based service waivers. Institutional care includes intermediate care facilities for the mentally retarded, nursing facilities, and mental health facilities. SOURCE: KCMU and Urban Institute analysis of HCFA/CMS-64 data. 13%
Medicaid Financing of Safety-Net Providers Public Hospital Net Revenues by Payer, 2008 Health Center Revenues by Payer, 2008 Total = $40 billion Total = $10.1 billion SOURCE : Data for public hospitals from America’s Public Hospitals and Health Systems,2008, National Association of Public Hospitals and Health Systems, February 2010. Health center data from 2008 Uniform Data System (UDS), Health Resources and Services Administration.
National Spending on Nursing Home and Home Health Care, 2006 Nursing Home Care Home Health Care Total = $124.9 billion Total = $52.7 billion Note: Medicaid percentage includes spending through SCHIP. Other includes private and public funds SOURCE: Kaiser Commission on Medicaid and the Uninsured, based on Health Affairs January/February 2008, CMS, National Health Accounts.
Medicaid plays a critical role for selected populations Percent with Medicaid coverage: Families Aged & Disabled SOURCE: Kaiser Commission on Medicaid and the Uninsured and Urban Institute analysis of ASEC Supplement to the CPS; Birth data from Maternal and Child Health Update: States Increase Eligibility for Children's Health in 2007, National Governors Association, 2008; Medicare data from USDHHS.
Median Medicaid/CHIP Eligibility Thresholds, January 2012 SOURCE: Based on the results of a national survey conducted by the Kaiser Commission on Medicaid and the Uninsured and the Georgetown University Center for Children and Families, 2012. Minimum Medicaid Eligibility under Health Reform - 133% FPL ($25,390 for a family of 3 in 2012)
Medicaid Eligibility for Working Parents by Income, January 2012 ME VT WA NH MT ND MN OR MA NY WI SD ID MI RI CT WY PA NJ IA NE OH DE IN IL NV MD CO UT WV DC VA CA KS MO KY NC TN AZ SC OK AR NM GA AL MS LA TX FL AK HI < 50% FPL (17 states) 50% - 99% FPL (16 states) 100% FPL or Greater (18 states, including DC) NOTE: The federal poverty line (FPL) for a family of three in 2011 is $18,530 per year. Several states also offer coverage with a benefit package that is more limited than Medicaid to parents at higher income levels through waiver or state-funded coverage. SOURCE: Based on the results of a national survey conducted by the Kaiser Commission on Medicaid and the Uninsured and the Georgetown University Center for Children and Families, 2012.
Per Capita Spending For Medicaid Enrollees vs.Low-Income Privately-Insured Samples adjusted for health differences Adults Children SOURCE: Hadley and Holahan, “Is Health Care Spending Higher under Medicaid or Private Insurance? “ Inquiry, Winter 2003/2004.
Medicaid-To-Medicare Provider Fee Ratios for All Services NH VT WA ME MT ND MN MA OR NY SD WI ID RI MI CT WY PA NJ IA NE OH IN WV DE NV IL IL UT VA MD CO KS MO KY CA NC DC TN OK SC AR AZ NM AL GA MS TX LA AK FL HI < 70% (11 states including DC) 70-84% (7 states) 85-99% (21 states) U.S. Average = 72% of Medicare fees 100%+ (11 states) NOTE: Tennessee does not have a fee-for-service component in its Medicaid program SOURCE: S. Zuckerman, AF Williams, and KE Stockley, “Trends in Medicaid Physician Fees, 2003-2008,” Health Affairs, 28 April 2009.
Statutory Federal Medical Assistance Percentages (FMAP), FY 2012 ME WA VT NH MT ND MN OR MA NY WI SD ID MI RI WY CT PA IA NJ NE OH DE IN IL NV MD CO UT WV VA CA DC KS MO KY NC TN AZ SC OK AR NM GA AL MS LA TX FL AK HI 50 percent (15 states) 51 – 59 percent (11 states) 60 – 66 percent (13 states) 67 – 74 percent (12 states including DC) NOTE: Rates are rounded to nearest percent. These rates will be in effect Oct. 1, 2011 – Sept. 30, 2012. SOURCE: Federal Register,, Nov, 10, 2010 (Vol. 75, No. 217), pp. 69082-69083. http://edocket.access.gpo.gov/2010/pdf/2010-28319.pdf