Download
1 / 29
290 likes | 417 Vues
West Virginia’s Involvement in the Chesapeake Bay Cleanup. Update and Timeline Alana Hartman, WV DEP January 13, 2010. WV’s Tributary Strategy Implementation Com’te WV Department of Environmental Protection WV Conservation Agency / Conservation Dist’s WV Department of Agriculture

E N D
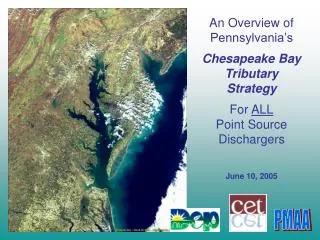
West Virginia’s Involvement in the Chesapeake Bay Cleanup Update and Timeline Alana Hartman, WV DEP January 13, 2010
WV’s Tributary Strategy Implementation Com’te WV Department of Environmental Protection WV Conservation Agency / Conservation Dist’s WV Department of Agriculture Cacapon Institute The Conservation Fund - Freshwater Institute Natural Resources Conservation Service WV Division of Forestry WV Division of Natural Resources USDA Farm Service Agency WVU Extension Service US Fish & Wildlife WV Water Resource Institute Trout Unlimited…others
In June of 2002, Governor Bob Wise signed the Chesapeake Bay Program Water Quality Initiative Memorandum of Understanding. By signing this memo, West Virginia agreed to develop goals and objectives to reduce nutrient and sediment loading. Reductions of 33% for nitrogen, 35% for phosphorus, and 6% for sediment are needed between the years 2002 and 2010. => WV’s Potomac Tributary Strategy (2005)
= WV’s Potomac Tributary Strategy (2005) Covered various sources of pollution: Point Sources: wastewater treatment plants industrial sources Nonpoint Sources: urban/suburban runoff agriculture forest harvesting septic systems … etc.
Much progress has been made:Voluntary actions by agricultural producers, homeownersCounty plans & ordinances revisedPoint Sources’ permits revisedEducation and outreach regarding good practicesLocal watershed groups enlisted/empowered to helpClean Water Act Section 319 Project Teams in Sleepy Creek and elsewhere, and $$
THE CHESAPEAKE BAY TMDL: Restoring Waters of West Virginia and the Chesapeake Bay Bay TMDL Public Meeting November 4, 2009 Martinsburg, WV Rich Batiuk and Bob Koroncai U.S. EPA Region III 6
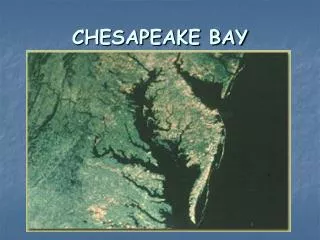
Chesapeake Bay Watershed-By the Numbers • Largest U.S. estuary • Six-state, 64,000 square mile watershed • 10,000 miles of shoreline (longer then entire U.S. west coast) • Over 3,600 species of plants, fish and other animals • Average depth: 21 feet • $750 million contribution annually to local economies • Home to 17 million people (and counting) • 77,000 principally family farms • Declared “national treasure” by President Obama Source: www.chesapeakebay.net 8
Nutrient Loads by State Nitrogen* Phosphorus *EPA estimates a nitrogen load of 284 million lbs nitrogen in 2008. EPA assumes a reduction of 7 million lbs due to the Clean Air Act. This leaves 77 millions lbs to be addressed through the TMDL process. 9
Chesapeake Bay Health- Past and Future 10
The Chesapeake Bay TMDL • EPA sets pollution diet to meet states’ Bay clean water standards • Load caps on nitrogen, phosphorus and sediment loads for all 6 Bay watershed states and DC • States set load caps for point and non-point sources 11
Nutrient Sources of WV Sources of Phosphorus from West Virginia Sources of Nitrogen from West Virginia N and P values from 2008 Scenario of Phase 5.2 Watershed Model 12
Local Water Quality Issues T Stream off South Branch of Potomac Mill Creek, Bunker Hill Heights 13
What are the Target Pollutant Cap Loads for the Bay Watershed? Current model estimates are that the states’ Bay water quality standards can be met at basinwide loading levels of: - 200 million pounds nitrogen per year - 15 million pounds phosphorus per year (Sediment target cap load under development-will be available by spring 2010) 14
Current State Target Loads Nitrogen Phosphorus All loads are in millions of pounds per year. 15
Needed Reductions • Caps = 5.71 MM#/yr N; 0.62 MM#/yr P • N needed = 7.27 - 5.71 = 1.56 MM#/yr • P needed = 0.66 - 0.62 = 0.04 MM#/yr • But, • Existing point source loads not = 2010 NA • Must deal w/ increased future loads (new point sources as well as landuse conversion by development) • Delivery factors change ______ Slide from DEP’s work-in-progress trying to understand how many reductions we can expect from point sources.
The Chesapeake Bay Performance and Accountability System 17
Employ Federal Actions or Consequences Monitor Progress to assess actions, load reduction progress and water quality response Mandatory Pollution Diet at Work Develop Watershed Implementation Plans • Plans include: • Sub-allocation of loadings to sources • Evaluation of Program Capacity necessary to achieve target loads • Identification of Gaps between needed and existing capacity • Schedule to fill gaps and reduce loads based on description of planned enhancements • Federal actions to accelerate controls • Federal consequences for inadequate state progress Establish Bay TMDL: • Total maximum nutrient and sediment loads • Wasteload and load allocations by state/DC, drainage area of tidal segments, and sector • Informed by Watershed Implementation Plans Set 2-Year Milestones • Controls and program enhancements to maintain schedule. • Contingencies by state/DC 18
Source Categories • 27 Sources, 24 land uses • 6 Categories • Agriculture (16) • Urban Runoff (6) • Wastewater (1) • Forest (2) • Septic (1) • Atm. Dep. (1)
Watershed Implementation Plan Expectations • Identify reductions by major river basin, tidal segment watershed, county and pollutant source sector • Identify gaps and strategy for building needed local capacity for pollution reduction actions • Commit to develop 2-year milestones at the county scale • Develop contingencies 20
Federal Consequences Will be outlined in an EPA letter this fall. May include: Assigning more stringent pollution reductions to regulated point sources (e.g., wastewater, stormwater, CAFOs) Objecting to state-issued NPDES permits Limiting or prohibiting new or expanded discharges (e.g., wastewater, stormwater) of nutrients and sediment Withholding, conditioning or reallocating federal grant funds 21
Bay TMDL- Presidential Executive Order Connections • Federal commitments to nutrient/sediment reduction actions • Work in concert to assure pollution cuts • Promote accountability, performance • Common components • Requirement for state/DC plans to reduce pollutants to meet Clean Water Standards • Two-year Milestones to keep pace to 2025 • Federal consequences if progress lags 22
Your Role in Bay TMDL Process Major basin jurisdiction loading targets Local Program Capacity/Gap Evaluation Final TMDL Established December 2010 Oct 2009 Bay TMDL Public Meetings Phase 2 Watershed Implementation Plans: Jan – Nov 2011 Divide Target Loads among Watersheds, Counties, Sources November-December 2009 Phase 1 Watershed Implementation Plans: November 2009 – August 2010 2-year milestones, reporting, modeling, monitoring Starting 2011 Public Review And Comment August-October 2010 23
Bay TMDL: Bottom-line • Actions will clean and protect local waters in WV thereby supporting the local economy • Restore a thriving Chesapeake Bay • Federal, state, local officials and agencies will be fully accountable to the public • Consequences for inaction, lack of progress WV has opportunity to craft a plan that agrees with local plans/priorities 24
Progress on WV’s Plan • WV DEP staff have been working on the point source numbers, as mentioned previously • WV’s “Implementation Committee” has been meeting to decide how to further sub-divide our allocations • By source sector • By county/other geographic area • In phases, e.g. by 2017 and by 2025
How to further sub-divide our allocations…By source sector, By county/other geographic area,In phases, e.g. by 2017 and by 2025Will be considering:Which land uses contribute the most N per acreWhich geographic areas have greater effect on BaySome local water quality goals, e.g. S. Branch algaeLocal efforts underway
WV’s 1st set of 2-year milestones • Nutrient trading/offset program (underway) June 2009: SB715 now a law, “Ches. Bay Restoration Initiative” funding must be in place for trading program soon • 7 specific agricultural BMPs at certain levels • 4 stormwater BMPs at certain levels • 3 septic system BMPs at certain levels • These were based on current implementation rates plus a little more ambitious
What you can do • Check WVCA’s Bay website for updates/opportunities • Help spread the word about various practices and opportunities: • Less fertilizer on lawns • More tree canopy left in developments, more infiltration of rainwater • Agricultural cost-share money is increasing; take advantage • Many others – more ideas on website
Further Information • Chesapeake Bay TMDL web site www.epa.gov/chesapeakebaytmdl • WV’s Chesapeake Bay web site www.wvca.us/bay Alana Hartman, WV DEP (304) 822-7266 alana.c.hartman@wv.gov 29