Transforming Laboratory Efficiency: Introduction to Aircuity Advisor Services
Discover how Aircuity's Advisor Services revolutionize laboratory operations. Smart Labs, designed to cut energy consumption by over 50%, offer enhanced safety and real-time data for informed decision-making. With features like fume hood sash management and intuitive dashboards, users can optimize energy use, maintain air quality standards, and reduce operational costs. This guide walks you through logging in, navigating features, and understanding air change rates, occupancy, and internal air quality metrics, paving the way for a sustainable lab environment. Learn more about maximizing your laboratory’s efficiency today!

Transforming Laboratory Efficiency: Introduction to Aircuity Advisor Services
E N D
Presentation Transcript
Introduction to Advisor Services What is a Smart Lab Background on Aircuity Advisor Services Software requirements Login and Navigation Fume hood sash management Next steps
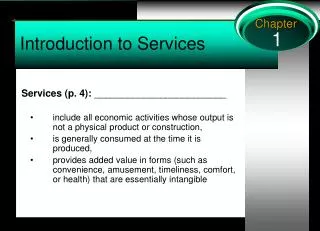
What is a “Smart Lab” “Smart Labs” are newly constructed or retrofitted laboratories that reduce building system energy consumption by 50% or more, augment established safety protocols and designs, and provide a data stream effectively commissioning the building at all times.
Mechanical System Balance Autoclaves Ultra -low temp freezers Refrigerators Incubators Water purification systems Microscopes Computers Shake tables Lighting Occupants Building Shell Windows 2-4 ACH Lower air change rates more closely match the natural lab process load,reducing both fan power and reheat.
The Smart Lab Information LayerDashboard and Data Trends for Each Zone • Air change rates (ACR) • Internal air quality (IAQ) • Sash position of each fume hood • Occupancy • Relative humidity • Temperature • Total supply • Total exhaust
Why did FM invest in Advisor? What benefit is Advisor to BFMI? Where can I learn more? http://www.aircuity.com/services/aircuity-advisor-program/
Getting Started Internet Explorer Microsoft Silverlight There is a push to re-develop the entire dashboard system into HTML5 but this may take some time. Please call OIT and request Silverlight be installed if it was not part of the installation package you received.
Advisor Login User Name = ucirvine Password = anteater Enter: User Name Password Click Login
Select a building you wish to review: Select the building you are interested in viewing
Dashboards is the most common selection Click the desired Advisor button to access that feature. A new page will open.
Use controls to set scope and time frame to view Drag dashblocks between the dashboard and palette Dashboard Controls Client Name and sensed location Dynamic Dashboard Dashblock Palette
Often an overwhelming number of dash blocks are loaded. Close them out until you are able to view a manageable amount of data.
This is the most useful report to share with the lab users. Sash management can save UCI thousands of dollars a year. We encourage you to distribute this report monthly. Client Name and sensed location
Select the “scope” of the view Client Name and sensed location Scope
Select the time period over which data is analyzed Client Name and sensed location Granularity
Select the start date Client Name and sensed location Start Date
Candlestick chart shows Min, Max and average for time period Compares current period to previous period Client Name and sensed location Min value for selected granularity
Candlestick chart shows Min, Max and average for time period Compares current period to previous period Client Name and sensed location Max value for selected granularity
Candlestick chart shows Min, Max and average for time period Compares current period to previous period Client Name and sensed location Red – indicates: Current Average is GREATER THAN Previous Average Previous Avg. Versus Current Avg.
Candlestick chart shows Min, Max and average for time period Compares current period to previous period Client Name and sensed location Green indicates: Current Average is LESS THAN Previous Average Previous Avg. Versus Current Avg.
Hover over the bar to display details Client Name and sensed location Detail Data
View hoods where sash management should be questioned • Hood or Lab is unoccupied but sash(es) are open Client Name and sensed location ✔ Check this box to view only unoccupied fume hoods ✔
Display just the current average sash position Client Name and sensed location Display only current values based on selected granularity ✔
AHU gives data from the high level overview Room breaks the data down
Advisor Services is still in the deployment phase some blocks show savings that don’t make sense, show flows that may be very high, etc. Please bring this to our attention.
Questions? https://webfiles.uci.edu/mgudorf/Intro%20to%20Advisor%20Slides.pptx