Download
1 / 38
390 likes | 716 Vues
LOW COST SAFETY IMPROVEMENTS. The Tools – Identification of High Crash Locations – Session #2. Identification of High Crash Locations. Learning Outcomes: Identify appropriate Engineering Countermeasures by using the 6 Step Crash Mitigation Process. List of .

E N D
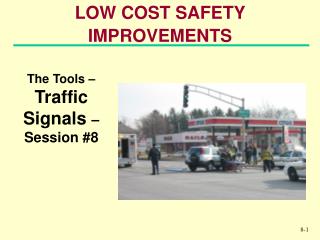
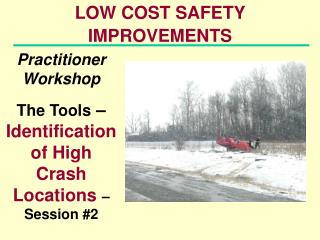
LOW COST SAFETY IMPROVEMENTS The Tools – Identification of High Crash Locations – Session #2
Identification of High Crash Locations Learning Outcomes: • Identify appropriate Engineering Countermeasures by using the 6 Step Crash Mitigation Process
List of Network Screening or Site Selection Sites for Review Document Detailed Engineering Study the Analysis Document Project Selection, the Implementation, & Evaluation Evaluation HSIP Planning
Conventional Screening • Conventional techniques of screening use are known to have difficulties in identifying ‘unsafe’ sites: • Crash counts = bias to high volume sites • Crash rates = bias to low volume sites • Crash rates’ assumption of linearity is invalid • Regression-to-mean (RTM) effect if sufficient allowance is not made for random errors
What is Network Screening? • Highway network system made up of segmentsand intersections • Network screening is a systematic examination of all entities • Purpose: To rank all entities, based on selected criteria, in order to conduct detailed safety studies http://www.ncdot.org//planning/statewide/gis/DataDist/CountyMap.html Money should go where it achieves the greatest effect in terms of preventing crashes and reducing their severity
PSI Index Approach • New and different approach to identify the Potential for Safety Improvement (PSI) • Application of Safety Performance Functions (SPFs) for each crash severity class for different reference groups • PSI values for fatal, injury and PDO crashes combined = PSI Index • Weights (relative cost) are applied to PSI values
PSI Index Screening • PSIIndex is estimated for each location • Locations are ranked in descending order of PSIIndex values • Locations with largest PSIIndex values have most potential for crash reduction
SafetyAnalyst Tools • Network screening to identify sites with promise for safety improvement • Diagnosis of safety concerns • Selection of countermeasures • Economic appraisal of countermeasures • Priority ranking of countermeasures • Evaluation of implemented projects
The six steps in the crash mitigation process • Identify Sites • Collect Crash Experience • Gather Field Conditions • Identify Contributing Factors and Countermeasures • Assess and Select Countermeasures • Implement and Evaluate
Step 1: Identify Sites with Potential Safety Problems • Crash data • Traffic Measures • Field Observations • Complaints • Enforcement input • Surrogate measures
Step 1: Identify Sites with Potential Safety Problems Crash Information Methods: • Total Number of Crashes • Crash Density (Crashes per mile) • Crash Rate (Crashes per million vehicle miles) • Number Quality Control • Rate Quality Control • Crash Severity • Severity Index • Crash Index
Crash Rate Calculation Roadway Segment: CR = N / [ADT x 365 x L x 10-6] where CR is expressed as “Crashes per million vehicle miles (or kilometers)” and N = Number of crashes per year ADT = Average Daily Traffic L = Length of segment (mi or km)
Crash Rate Calculation: Segment Example: For N = 50 crashes for 3 year period ADT = 3,000 Average Daily Traffic L = 2.8 miles CR = N / [ADT x 365 x L x 10-6] CR = 50 / [3,000 ADT x 3 yrs x 365 x 2.8 miles x 10-6] CR = 5.43 crashes per million vehicle miles
Step 1: Identify Sites with Potential Safety Problems *From Mn DOT Traffic Safety Fundamentals Handbook
Crash Rate Calculation Intersection: CR = N / {[Sum (ADT)s /2] x 365 x 10-6} where CR is expressed as “crashes per million entering vehicles” and N = Number of crashes per year Sum (ADT)s = Sum of all Average Daily Traffic entering the intersection
Crash Rate Calculation: Intersection Example: For N = 25 crashes for 3 years ADT (N) = 10,000 ADT (S) = 9,000 ADT (E) = 3,500 ADT (W) = 4,000 Sum (ADT)s=(10,000+9,000+3,500+4,000) = 26,500 CR = N / {[Sum (ADT)s /2] x 365 x 10-6} CR = 25/ {26,500/2] x 3 yrs x365 x 10-6} CR = 1.72 crashes per million entering vehicles
Average Intersection Crash Rates • Average of 1.5 crashes per year for Un-Signalized Intersections in rural areas– recent California analysis* • Average of 2.5 crashes per year in urban areas *NCHRP 500, Volume 5: A Guide for Addressing Unsignalized Intersection Collisions, 2003.
Severity Index Severity index (SI) is the ratio of crashes involving an injury or fatality to total crashes
Step 2: Characterize the Crash Experience Prepare a Collision Diagram
Non-Crash Based Procedures References- Appendix A:
Step 4: Identify Contributing Factors and Appropriate Countermeasures *See Appendix for Tables 12, 13, 14 and 15
Step 5: Assess Countermeasures and Select Most Appropriate Page 11-14 of Appendicies • See Appendix Tables 12, 13, & 14 for “Contributing Factors” Poor Delineation
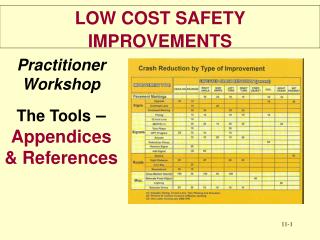
Step 5: Assess Countermeasures and Select Most Appropriate • go to Table of Crash Reduction Factors in the Appendicies, page 11-22, Warning Signs, 3rd row
Step 6: Implement Countermeasures and Evaluate Effectiveness Improve Delineation - Advance Warning Sign for Curve with Advisory Speed Plaque CRF = 22%
Step 3: Characterize Field Conditions Traffic Data Studies: • Traffic Volume – Turning Movement, ADT • Spot Speeds • Traffic Conflict Study • Sight Distance Evaluation
Traffic Crash Costs: AIS Level Cost Per Injury SeverityDescriptor(Dollars) Property Damage Only 65,000 AIS 3 Serious Injury 175,000 AIS 4 Severe 565,000 AIS 5 Critical 2,290,000 AIS 6 Fatal 3,000,000
Identification of High Crash Locations – Exercise III • For the Countermeasure Advance Curve Warning Signs + Advisory Speed Plaque = 22%; Calculate the benefit $$ for “before period” of 7 crashes Discussion
Introduction – Exercise III • For the Countermeasure Advance Curve Warning Signs + Advisory Speed Plaque = 22% Discussion Benefit for “Before Period of 7 Crashes = 7 crashes x CRF of 22% = 7 x 0.22 = 1.54 crashes reduced Severity distribution = 0.32 (Inj+Fatal) + 0.68 Pdo Benefit = (1.54 x 0.32 x $565,000) + (1.54 x 0.68 x $65,000) = $345,100
Identification of High Crash Locations Appendix H: Typical Benefit/Cost Ratios * From MN DOT Traffic Safety Fundamentals Handbook
Identification of High Crash Locations Review Questions: • What are the six steps in the crash mitigation process?
Review: What are the six steps in the crash mitigation process? • Identify Sites • Collect Crash Experience • Gather Field Conditions • Identify Contributing Factors and Countermeasures • Assess and Select Countermeasures • Implement and Evaluate
Identification of High Crash Locations Review Questions: Lighting CRF = 50+% • What low cost safety measure has the highest benefit to cost ratio?
Identification of High Crash Locations Learning Outcomes: • Identify appropriate Engineering Countermeasures by using the 6 Step Crash Mitigation Process
Identification of High Crash Locations Questions?