Download
1 / 35
350 likes | 478 Vues
This workshop focuses on identifying high crash locations through a systematic network screening process. Participants will learn about the Highway Safety Improvement Program (HSIP) Planning Process and the Crash Mitigation Process while exploring effective engineering countermeasures for safety improvements. The workshop emphasizes practical steps such as identifying potential safety problem sites, collecting and analyzing crash data, and assessing contributing factors to select appropriate interventions. By understanding these concepts, attendees will gain valuable tools to enhance roadway safety and reduce crash severity.

E N D
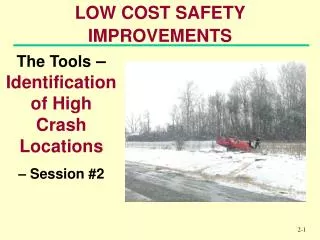
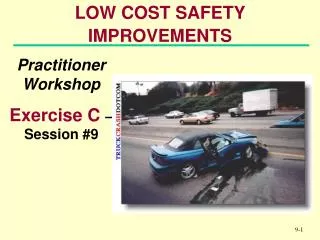
LOW COST SAFETY IMPROVEMENTS Practitioner Workshop The Tools – Identification of High Crash Locations– Session #2
Identification of High Crash Locations Learning Objectives: • Describe the HSIP Planning Process • Crash Mitigation Process • Identify appropriate Engineering Countermeasures from Crash Patterns
List of Network Screening or Site Selection Sites for Review Document Detailed Engineering Study the Analysis Document Project Selection, the Implementation, & Evaluation Evaluation HSIP Planning
What is Network Screening? • Highway network system made up of segmentsand intersections • Network screening is a systematic examination of all entities • Purpose: To rank all entities, based on selected criteria, in order to conduct detailed safety studies http://www.ncdot.org//planning/statewide/gis/DataDist/CountyMap.html Money should go where it achieves the greatest effect in terms of preventing crashes and reducing their severity
Identification of High Crash Locations The six steps in the crash mitigation process
The six steps in the crash mitigation process • Identify Sites • Collect Crash Experience • Gather Field Conditions • Identify Contributing Factors and Countermeasures • Assess and Select Countermeasures • Implement and Evaluate
Identification of High Crash Locations Step 1: Identify Sites with Potential Safety Problems • Crash data • Traffic Measures • Field Observations • Complaints • Enforcement input • Surrogate measures
Identification of High Crash Locations Step 1: Identify Sites with Potential Safety Problems • Crash data • Total Number of Crashes • Crash Density (Crashes per mile) • Crash Rate (Crashes per million vehicle miles) • Number Quality Control • Rate Quality Control • Crash Severity • Severity Index • Crash Index
Most CommonReporting Errors • Crash location • Direction of travel • Driver action • Pedestrian condition • Vertical road characteristics
Conventional Screening • Conventional techniques of screening in use are known to have difficulties in identifying ‘unsafe’ sites: • Crash counts = bias to high volume sites • Crash rates = bias to low volume sites • Crash rates’ assumption of linearity is invalid • Regression-to-mean (RTM) effect if sufficient allowance is not made for random errors
Identification of High Crash Locations Roadway Segment: CR = N / [ADT x 365 x L x 10-6] where CR is expressed as “Crashes per million vehicle miles (or kilometers)” and N = Number of crashes per year ADT = Average Daily Traffic L = Length of segment (mi or km)
Identification of High Crash Locations Example: For N = 50 crashes for 3 year period ADT = 3,000 Average Daily Traffic L = 2.8 miles CR = N / [ADT x 365 x L x 10-6] CR = 50 / [3,000 ADT x 3 yrs x 365 x 2.8 miles x 10-6] CR = 5.43 crashes per million vehicle miles
Identification of High Crash Locations Different Hwy Types Experience Different Crash Rates
Identification of High Crash Locations Step 1: Identify Sites with Potential Safety Problems *From Mn DOT Traffic Safety Fundamentals Handbook
Identification of High Crash Locations Intersection: AR = N / {[Sum (ADT)s /2] x 365 x 10-6} where AR is expressed as “crashes per million entering vehicles” and N = Number of crashes per year Sum (ADT)s = Sum of all Average Daily Traffic entering the intersection
Identification of High Crash Locations Example: For N = 25 crashes for 3 years ADT (N) = 10,000 ADT (S) = 9,000 ADT (E) = 3,500 ADT (W) = 4,000 Sum (ADT)s=(10,000+9,000+3,500+4,000) = 26,500 AR = N / {[Sum (ADT)s /2] x 365 x 10-6} AR = 25/ {26,500/2] x 3 yrs x365 x 10-6} AR = 1.72 crashes per million entering vehicles
Identification of High Crash Locations Collision Types at Rural Intersections
Identification of High Crash Locations Intersection Crash Rates • Average of 1.5 crashes per year for Un-Signalized Intersections in rural areas– recent California analysis* • Average of 2.5 crashes per year in urban areas *NCHRP 500, Volume 5: A Guide for Addressing Unsignalized Intersection Collisions, 2003.
Identification of High Crash Locations Step 2: Characterize the Crash Experience Prepare a Collision Diagram
Identification of High Crash Locations Step 3: Characterize Field Conditions
Identification of High Crash Locations Step 3: Characterize Field Conditions Traffic Data Studies: • Traffic Volume – Turning Movement, ADT • Spot Speeds • Traffic Conflict Study • Sight Distance Evaluation
Identification of High Crash Locations Non-Crash Based Procedures
Identification of High Crash Locations Step 4: Identify Contributing Factors and Appropriate Countermeasures *Table 12, from Missouri HAL Manual
Identification of High Crash Locations Step 5: Assess Countermeasures and Select Most Appropriate
Identification of High Crash Locations Probable Causes for Crash Patterns and Engineering Countermeasures Rear-End Collisions at un-signalized intersection
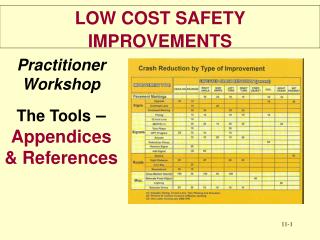
Identification of High Crash Locations • Documents list “Crash Reduction Factors” (CRF) and “Accident Modification Factors” (AMF) for specific types of crashes • CRF : • (+) number is % reduction in crash type • (-) number is % increase in crash type
Identification of High Crash Locations • “Accident Modification Factors” (AMF) for specific types of crashes • AMF : • ratio of (after) crashes / (before) crashes • AMF < 1 means a reduction in crash type • AMF > 1 means an increase in crash type • AMF = 1- CRF
Identification of High Crash Locations Estimated Crash Reduction Factors Install Warning Signs
Identification of High Crash Locations Estimated Crash Reduction Factors * From MN DOT Traffic Safety Fundamentals Handbook
Identification of High Crash Locations Traffic Crash Costs: *NCHRP 440
Identification of High Crash Locations Traffic Crash Costs: * From MN DOT Traffic Safety Fundamentals Handbook
Identification of High Crash Locations Typical Benefit/Cost Ratios * From MN DOT Traffic Safety Fundamentals Handbook
Identification of High Crash Locations Step 6: Implement Countermeasures and Evaluate Effectiveness Improve Sight Distance – 5% Crash Reduction per Quadrant – 20% for all 4 quadrants
Identification of High Crash Locations Review Questions: • What are the six steps in the crash mitigation process?
Identification of High Crash Locations Questions?