Download
1 / 14
140 likes | 296 Vues
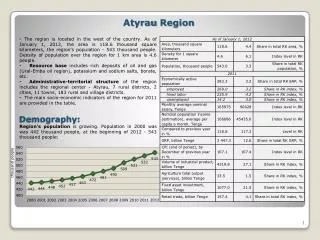
Atyrau Region. The region is located in the west of the country. As of January 1, 2012, the area is 118.6 thousand square kilometers, the region's population - 543 thousand people. Density of population over the region for 1 km area is 4.6 people.

E N D
Atyrau Region • The region is located in the west of the country. As of January 1, 2012, the area is 118.6 thousand square kilometers, the region's population - 543 thousand people. Density of population over the region for 1 km area is 4.6 people. • Resource base includes rich deposits of oil and gas (Ural-Emba oil region), potassium and sodium salts, borate, etc. • Administrative-territorial structure of the region includes the regional center - Atyrau, 7 rural districts, 2 cities, 11 towns, 183 rural and village districts. • The main socio-economic indicators of the region for 2011 are provided in the table. Demography: Region's population is growing. Population in 2000 waswas 442 thousand people, at the beginning of 2012 - 543 thousand people: 1
The number of employed population increases and unemployed population falls in both absolute and relative terms. For 10 years, from 2001 to 2011, the employed population has increased from 86 to 95%, while the number of unemployed people has fallen from 14 to 5%. • Characteristic feature of the employed population dynamics is the growth of hired labor and the reduction of self-employed people. From 2001 to 2011 the number of hired labor has increased from 72 to 88%, the number of self-employed people has fallen from 28 to 12%. These results are above the average in Kazakhstan: EAP of the region is increasing at a moderate pace and in 2011 it reached 283.3 thousand people. 269 thousand people of those are employed, 14.2 thousand people are unemployed. Economically inactive population made up 90 thousand in 2011, it is lower than in 2000: Economically active population (EAP)
The changes of employed population structure are supported by a strong tendency of unemployment rate reduction from 15.5% in 2000 to 5% in 2011 and an increase in economic activity of the population: • In 2011 unemployment rate of the region was below the Kazakhstan’s average - 5.4%: Unemployment
Quality of Life • Cost of living has been growing steadily since 2003, but the values are below the average in RK: • Life expectancy at birth in the region has increased and in recent years exceeds the RK values: • Some of life quality indicators in 2011: • Share of population with income used for consumption below the poverty line is decreasing dramatically from 2001 to 2011, now it’s below the average in RK:
Enrollment • Enrollment share of the population aged 6-24 years has decreased from 2001 and in 2011 it is below the average in RK: • The number of children in regular preschools has increased significantly since 2001: • The number of students in technical and vocational education has increased, however, the decline of 2010 and 2011 is contrary to the positive dynamics of the region's population: • The number of students in higher education declines despitean increase of the region’s population:
Monthly average nominal salary per employee for 2011 was 165,975 Tenge, it is almost 2 times higher than the national average – 90,028 KZT: • In dynamics the average nominal salary per employee and the average nominal income per capita are ever-growing: • The index of the nominal and real incomes showed a decline during the economic crisis in 2009. In 2006 the growth of nominal income was lower than the consumer price index, i.e. revenue growth did not cover inflation: Population Income
However, GRP growth in 2011 is below the growth of total GRP of all the regions of Kazakhstan and makes up 121.2% compared to 2010, against the total value of RK - 126.4%: • GRP shows steady growth, share of the region in total GRP of all the regions shows the same trend - it has increased from 9.4% in 2000 to 12.5% in 2011: Economy
Investment • The growth of fixed assets investment in 2011 is not just below the total levelof all RK regions, but it also showed the negative valuecompared to2010 – 97.4% against 107.7% in general in RK: • Fixed assets investment tends to a stable significant growth, however, the values showed a decline in 2011: • The share of fixed assets investment in the Kazakhstan’s level of investment varied greatly over time, however, it increased from 20% in 2000 to 21.5% in 2011: 8
Agriculture • The share of the region’s volume of production in agriculture in total Kazakhstan’s volume of industry’s production is insignificant, and in 2010 it made up 1.3% of agriculture production in the country: • The volume of production in agriculture was increasing until 2009, it decreased in 2010 to 19.5 billion Tenge: 9
Real Sector • The growth of industrial production volumes was observed throughout the study period: • Real sector industries with the highest volumes of production in 2010 were the extraction of crude oil and natural gas, construction, manufacture of coke and refined petroleum products, and other mining and quarrying, manufacturing and electricity, gas and water, etc. These industries have significant share of total production in the Republic of Kazakhstan: • The share of industrial production in the Kazakhstan’s level increased from 22% in 2000 to 27% in 2011: 10
Sector Enterprises The number of industrial enterprises has shown a stable growth: • The number of construction companies is increasing, while its share in Kazakhstan’s level is falling: • The number of working agricultural enterprises is growing and its share in Kazakhstan’s level is declining:
SME • The number of registered legal entities as of October 1, 2012 is 9 748. The SME number is 9 678. The structure of the enterprises number is close to the RK average level: • SME share of the region's GRP grew until 2008, but it is lower than the RK’s average level:
Budget revenues of Atyrau region in 2011 amounted to 146.2 trillion Tenge, including 32.3 trillion Tenge of transfers from the national budget. Expenses amounted to 148.7 trillion Tenge, including 42.2 trillion Tenge of transfers to the national budget. Thus, the region is a contributor to the Republican budget: Interbudgetary Relations
Main target indicators: • GRP increase by 2015 shall be 37.9% in real terms compared to 2009; • Volume index of industrial production in 2015 compared to 2009 - 148%; • Volume index of mining industry in 2015 compared to 2009 - 139%; • Volume index of processing industry in 2015 compared to 2009 - 263%; • An increase of processing industry share in industry structure - no less than12.5%; • An increase of labor productivity in the processing industry by 2015 - no less than 1.5 times; • Volume index of products of the construction industry in 2015 - 204%; • Volume index of machine industry in 2015 by 2009 - 3.3 times; • Reduction of GRP energy output less than 10%; • Share of local content in the procurement of government agencies and organizations, strategic products enterprise - 65% • Share of local content in the procurement of government agencies and organizations, strategic operations and services enterprises - 91.3%; • Share of innovative companies up to 10% of the number of acting enterprises; • Volume of fixed assets formation in 2015 - 1500 billion Tenge (2009 - 1083.2 billion Tenge); • Share of small and medium businesses in the GRP in 2015 - 11% (2009 - 7%); • Volume index of agricultural production in 2015 compared to 2009 - 123.6%; • Labor productivity in the agricultural sector in 2015 by 2009 - 1.2 times; • Unemployment rate in 2015 shall drop to 5.5%; • Share of the population with incomes below the living wage in 2015 - 9.2%; • Natural gas supply by 2015 shall be 100%. Atyrau Region Development Program for 2011-2015