Ch. 16- Genes and Variation
Ch. 16- Genes and Variation. What you will learn today…. How do we measure genetic variation in a population? What are the sources of genetic variation in a population? Why is genetic variation in a population important?. What determines a heritable trait?. DNA (gene). Observed trait.

Ch. 16- Genes and Variation
E N D
Presentation Transcript
What you will learn today… • How do we measure genetic variation in a population? • What are the sources of genetic variation in a population? • Why is genetic variation in a population important?
What determines a heritable trait? DNA (gene) Observed trait mRNA protein translation transcription protein function (enzyme activity) Therefore, if traits vary in a population, then the genes (alleles) must vary in the population!
How do we measure genetic variation in a population? Gene Pool- Total genetic information available in a population (all the alleles that are present). Allele (Relative) Frequency- The percentage of an allele in the gene pool. Tells you whether a given allele is common or rare (%)
New Vocab • Population – group of individuals of the same species that interbreed • Gene Pool – all genes (including all alleles) present in a population • Relative Frequency – number of times an allele occurs in a gene pool
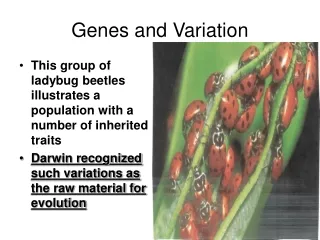
A population with variation in traits… Grey White Tall ears Short ears
...is caused by variation in alleles Grey allele = G White allele = g Tall ear allele = T Short ear allele = t T t G G t t G g T T G g t t g g t t G g t t G G T t g g t t G g
How do we measure genetic variation in a population? Grey allele = G White allele = g Tall ear allele = T Short ear allele = t 8 / 16 = 50% G T t G G t t G g T T G g t t g g 8 / 16 = 50% g t t G g t t G G 4 / 16 = 25% T T t g g t t G g 12 / 16 = 75% t “Gene Pool”
Why is genetic variation in a population important? • A gene pool without much variation limits a species’ ability to further evolve. • Evolution- change over time in the gene pools of a species • If populations do not change (adapt) to their environment, they may become extinct.
Sources of genetic variation • SEXUAL REPRODUCTION • Meiosis – one allele is passed on from each parent(recall that sperm and eggs are haploid cells, each containing half the necessary genetic information). • Random fertilization – only one of the millions of sperm involved in mating will fertilize the egg. The randomness of sexual reproduction explains why siblings can look so different.
Crossing over during meiosis http://www.sciencegeek.net/Biology/review/graphics/Unit3/meiosis.jpg
Sources of genetic variation • MUTATION A change in DNA sequence. New DNA sequence = new allele of a gene. • Many mutations produce genes that are harmful (e.g. Huntington’s disease) • Some mutations produce genes that are neutral (neither helpful nor harmful) • Very, very few mutations produce genes that are advantageous, beneficial
Mutations add new alleles to the gene pool. That is, they increase the variety of alleles in the population.
Deck of Cards Analogy Deck is Gene Pool – It contains all possible alleles for the next generation. Drawing cards picks the alleles that are inherited by the next generation. Shuffling of the deck is sexual reproduction. Adding new cards to the deck is mutation. (Mutation is rare, but shuffling happens each time a new generation is produced)
Natural Selection • Individuals with advantageous genes survive to reproduce and pass on these genes to their offspring. • Individuals without advantages genes do not survive to reproduce, and these genes do not get passed on in the population.
Warmup: Allele Frequency example Figure 16-2, pg. 394- work out the frequency of each allele. Sample Population Frequency of Alleles allele for brown fur, b allele for black fur, B 48% heterozygous black, Bb 16% homozygous black, BB 36% homozygous brown, bb
Sources of Genetic Variation • Mutations • Mistakes in replication • Radiation or chemicals in environment • Gene Shuffling • Assortment of chromosomes • Crossing over
Single-Gene Trait • Variation in single gene traits lead to only two distinct phenotypes • Frequency of phenotype determined by frequency of alleles 100 80 60 40 20 0 Frequency of Phenotype (%) Widow’s peak No widow’s peak Phenotype
Polygenic Trait • Trait controlled by 2 or more genes • Many possible genotype and phenotype possibilities • Bell shaped curve typical of polygenic traits Frequency of Phenotype Phenotype (height)
CHECK POINT • How do we measure genetic variation in a population? • What are the sources of genetic variation in a population? • Why is genetic variation important in a population?
Homework • Read section 16-1 in textbook (pages 393-396) • Complete worksheet 16-1: Genes and Variations
Natural Selection on Polygenic Traits Low mortality, high fitness DirectionalSelection High mortality, low fitness Food becomes scarce • Individuals at one end of curve have higher fitness • Range of phenotypes shifts
Natural Selection on Polygenic Traits • Individuals near center of curve have highest fitness • Keeps center of curve at same position and narrows graph Stabilizing Selection Low mortality, high fitness High mortality, low fitness Selection against both extremes keeps curve narrow and in same place Percentage of Population Birth Weight
Natural Selection on Polygenic Traits Disruptive Selection Largest and smallest seeds become more common Population splits into two subgroups specializing in different seeds. Low mortality, high fitness Number of Birds in Population Number of Birds in Population High mortality, Low fitness Beak Size Beak Size • Individuals at upper and lower ends of the curve have higher fitness than individuals in the middle • Selection acts strongly against individuals of the intermediate type
Genetic Drift • Random change in allele frequency by chance • Occurs in small populations • Founder effect – allele frequencies change as a result of migration of subgroup of population
Genetic Drift Section 16-2 Sample of Original Population Descendants Founding Population A Founding Population B
Genetic Drift Section 16-2 Sample of Original Population Descendants Founding Population A Founding Population B
Genetic Drift Section 16-2 Sample of Original Population Descendants Founding Population A Founding Population B
Hardy-Weinberg Principle- Are there any conditions when evolution DOES NOT happen? • States that allele frequencies remain constant (genetic equilibrium) unless one or more factors cause them to change • No change in allele frequency of population = no evolution in population
Mechanisms for Evolution • Random genetic drift • Gene flow • Non-random mating • Mutation • Natural selection
5 Conditions of Genetic Equilibrium-1 or more of these must happen in order for evolution to occur • Random Mating • Equal chance of passing on alleles to offspring • Large Populations • Genetic drift less likely to occur • No Movement In or Out of Population • New members might bring new alleles
5 Conditions of Genetic Equilibrium • No Mutations • New alleles may be introduced • No Natural Selection • All genotypes must have equal chance of survival and reproduction
Speciation • Speciation = formation of new species • Species = group of organisms that breed with one another and produce fertile offspring • As new species evolve, populations become reproductively isolated from each other
Isolating Mechanisms(lacewing interactive) • Behavioral Isolation • Differences in courtship rituals or other reproductive strategies • Geographic Isolation • Two populations separated by geographic barrier such as rivers, mountains or bodies of water • Temporal Isolation • Two or more species reproduce at different times of the day or year
Geographic isolation Behavioral isolation Temporal isolation Physical separation Behavioral differences Different mating times Reproductive Isolation results from Isolating mechanisms which include produced by produced by produced by which result in Independentlyevolving populations which result in Formation ofnew species
Speciation of Darwin’s Finches • Founders Arrive • Separation of Populations • Changes in the Gene Pool • Reproductive Isolation • Ecological Competition • Continued Evolution
Speciation in the Andes (Ecuador) • Hummingbird video • Explain the hypothesis presented by the scientists profiled in this segment to explain the process of speciation in hummingbirds and possibly other species. • How does this hypothesis differ from the traditional view that speciation often requires geographic separation of populations? • Why were the researchers collecting blood from the populations they studied? Discuss at least two possible analyses that could be performed on those samples and, identify at least two different questions that might be answered with sufficient data.