Visualizations TIARA trend visualization combining river theme and word cloud metaphor
40 likes | 221 Vues
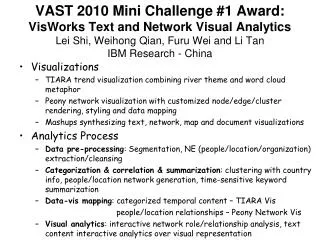
VAST 2010 Mini Challenge #1 Award: VisWorks Text and Network Visual Analytics Lei Shi, Weihong Qian, Furu Wei and Li Tan IBM Research - China. Visualizations TIARA trend visualization combining river theme and word cloud metaphor

Visualizations TIARA trend visualization combining river theme and word cloud metaphor
E N D
Presentation Transcript
VAST 2010 Mini Challenge #1 Award:VisWorks Text and Network Visual AnalyticsLei Shi, Weihong Qian, Furu Wei and Li TanIBM Research - China • Visualizations • TIARA trend visualization combining river theme and word cloud metaphor • Peony network visualization with customized node/edge/cluster rendering, styling and data mapping • Mashups synthesizing text, network, map and document visualizations • Analytics Process • Data pre-processing: Segmentation, NE (people/location/organization) extraction/cleansing • Categorization & correlation & summarization: clustering with country info, people/location network generation, time-sensitive keyword summarization • Data-vis mapping: categorized temporal content – TIARA Vis people/location relationships – Peony Network Vis • Visual analytics: interactive network role/relationship analysis, text content interactive analytics over visual representation
Visual Analytics of Player and Key Location Network • Same network with player icon size mapped to node betweenness centrality in the graph, key players connecting the groups are revealed • Player networks built from documents by NE extraction and correlation • Network with player’s nationality and inter-country connection highlighted (orange edge), player icon size indicates occurrence in the documents • Color coding the node icon with player group info, again “Dubai” is connecting different player groups together, it is hypothesized that they will come together at “Dubai” for the final arms dealing • More connected network after adding key locations, icon size still mapped to node betweenness centrality, “Dubai” is bridging disconnected components
Text Content Summarization & Analytics • Synthesized visualization of people/locations/activities by country (group) • Drill down to one specific country “Venezuela” and the discovery of “call-send-transfer-meet” pattern