Download
1 / 39
420 likes | 610 Vues
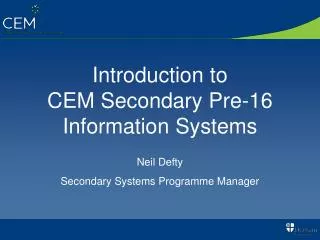
Introduction to CEM Secondary Information Systems. Dr Robert Clark ALIS Project Manager. The Analysis. Linear Least Squares Regression. Subject X. -ve VA. +ve VA. 0 2 4 6 8. Residuals. Regression Line (…Trend Line, Line of Best Fit) Outcome = gradient x baseline + intercept

E N D
Introduction to CEM Secondary Information Systems Dr Robert Clark ALIS Project Manager
. Linear Least Squares Regression Subject X -ve VA +ve VA 0 2 4 6 8 Residuals Regression Line (…Trend Line, Line of Best Fit) Outcome = gradient x baseline + intercept Correlation Coefficient (~ 0.7)
A* B C Alf Bob Subject A D Result Chris E Subject B F G U Low Ability Average Ability High Ability Baseline Score Measuring Value-Added – An Example National Trend ‘Average’ Student -ve (- 2 grades) +ve (+ 2 grades) The position of the national trend line is of critical importance
Photography Sociology English Lit Psychology Maths Physics Latin Some Subjects are More Equal than Others…. A-Level (Alis) A* A B Grade > 1 grade C D E C B A A* Average GCSE
Biology Business and Management Chemistry Design Technology Economics English_A1 Film French_B Geography History Mathematics Music Philosophy Physics Psychology Spanish_B Theatre Arts Visual Arts Some Subjects are More Equal than Others…. IB (Alis) 7 6 Grade 5 4 C B A A* Average (I)GCSE Score
A* A B Art & Design Biology GCSE Grades Chemistry C Economics English French Geography German D History Ict Mathematics Media Studies Music E Physical Education Physics Religious Studies Science (Double) Spanish F Test Score Some Subjects are More Equal than Others…. GCSE (MidYIS or Yellis) 1 grade
Standardisation of Residuals • (Raw) Residuals can be used to examine an individual’s performance • Standardised Residuals are used to compare performance of groups • Standardised Residuals are independent of year or qualification type • For a class, subject, department or whole institution the Average Standardised Residual is the ‘Value-Added Score’ • Standardised Residual = Residual / Standard Deviation (National Sample) • When using Standardised Residuals then for an individual subject where N = number of results in the group (for combinations of subjects consult the relevant project) • 95% Confidence Limit = 2.0 x Standard Error • 99% Confidence Limit = 2.6 x Standard Error • 99.7% Confidence Limit = 3.0 x Standard Error
Alis : yr 12/13 Yellis : yr 10/11 Secondary Age Range Projects Insight : Yr 9 MidYIS : Yr 7/8/9 InCAS : Primary Pips : Primary
Measure Baseline Prediction Reports Collect Results Value-Added Feedback Typical Timeline Autumn Term August September
A / AS / IB etc GCSE Alis Paper test (TDA) or Computer Adaptive Baseline Test GCSE Yellis Paper test or Computer Adaptive Baseline Test MidYIS Paper test or Computer Adaptive Baseline Test Baselines Year 13 Year 12 Year 11 Year 10 Combines curriculum tests with developed ability (end Y9 & end Y8) INSIGHT Year 9 Year 8 (+ additional) Year 7
Problems with Key Stage Baselines • Not all students have KS baselines • no KS2 / KS3 • Foreign Students • (Vocational Students) • (Adult Learners) • KS exams do not always represent ‘Start of Course’ ability • Post-16 : Year(s) out or intermediate years • Prior Value-Added • Can you add value at every Key Stage ? • Under achievement leading to under expectation • One teacher’s output = another teacher’s input • A level playing field ? • Teaching to the test • Does performance represent ability, effort or exam technique ? • Aptitude & fluency vs Achievement & knowledge
Average GCSE = 6 Average GCSE = 6 Average GCSE = 6 The Effect of Prior Value Added Beyond Expectation +ve Value-Added In line with Expectation 0 Value-Added Below Expectation -ve Value-Added Do these 3 students all have the same ability ?
yrs 7 / 8 / S1 / 9 / S2 yrs 10 / 11 yrs 12 / 13 + • Although Key Stage baselines can be a very good indicator of potential attainment, by themselves they are not sufficient. • Key Stage baselines are confounded by the effects of prior treatment. Need for independent, non-curriculum embedded baseline tests Online Computer Adaptive or Traditional Paper
The Computer Adaptive Test • Test performed online – results automatically transmitted to CEM. • LAN version available if Web access unreliable. • Minimal installation / setup required - if any. • Adaptive – difficulty of questions changes in relation to ability of student. • Efficient – no time wasted answering questions that are far too easy or difficult. • Wider range of ability • Less stressful on students – more enjoyable experience than paper test. • Less demanding invigilation. • Cheaper ! In 2009 / 2010 over 200,000 students across yrs 7-13 sat this test Try it yourself at www.inturproject.org/demos
Baseline Feedback Reports, Graphs & Predictions
IPRs (Individual Pupil Record Sheets) Look for sections that are inconsistent Also available based on MidYIS, Alis & INSIGHT scores
Intake Profiles Also available based on MidYIS, Yellis and INSIGHT scores
Average performance by similar students in past exams Predictions • Predictions are available in the following forms: • Formal Reports (Alis) • Spreadsheets (All Projects) • Paris Software (Alis / Yellis / MidYIS) • Feedback is available on Web / CD
Predictions – MidYIS example Similar spreadsheets available from Yellis and INSIGHT
Value-Added Feedback Reports & Graphs
Value Added Feedback… What is my score ? does it matter? Statistical Process Control (SPC) Chart 2000 2001 2002 2003 2004 2005 2006 2007 2008 2009 2010 Year
Subject Summary Standardised Residual Graph
Grade Points Equivalent Baseline Score The Scatter Plot Look for Patterns… General Underachievement / over achievement ? Do any groups of students stand out ? – high ability vs low ability ? – male vs female ?
Other things to look for… Why did these students do so badly ? Why did this student do so well ? How did they do in their other subjects ?
Independent Schools Analysis
MidYIS provides… • Independent schools baseline standardisation • Independent schools specific predictions & chances graphs • 7 Band Intake profiles • Independent schools specific value-added analysis Alis provides… • Independent schools specific value-added analysis Q. Which one should I use – Independent only analysis or all schools analysis ? A. It depends on what question you are asking…
PARIS is ….. • Software to install and use in school • An interactive reporting tool • Included free with Alis / Yellis / MidYIS PARIS analyses ….. • Potential Performance • Intermediate Performance • Actual Performance PARIS provides ….. • Student level reports • Subject Level reports • Institution Level Reports
There is more to school / college than exams…. • Student attitudes • Student Welfare & Safety • Non-academic activities • Support • Social and personal development • Parental Survey • Induction Survey Self Evaluation (Every Child Matters) Attitudinal MidYIS INSIGHT Attitudinal Yellis Full ALIS Try it yourself at www.inturproject.org/demos
Points to mull over… • Independence – no agendas • Transparency of Analysis • Self Evaluation • Straightforward and standardised administration • Prompt Feedback • Full working hours phone / email support • Student focus • Replacement for KS3 • Innovative online adaptive testing available – student experience • Longitudinal analysis with appropriate error backgrounds • Non-curriculum embedded baselines available • Attitudinal surveys available – Every Child Matters…
Dr Robert Clark Alis Project Manager robert.clark@cem.dur.ac.uk 0191 33 44 193