Download

1 / 17
170 likes | 272 Vues
Develop diagnostic tools for farmers to apply optimum nitrogen rate in wheat, transferring technology into fields. Detailed trial results and sensor experiments presented.

E N D
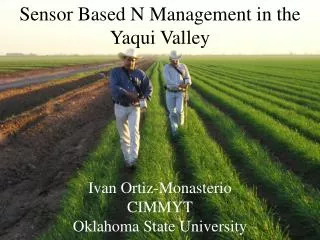
Wheat Nitrogen Diagnostics in the Yaqui Valley
OBJECTIVE • To develop diagnostic tools that will help farmers apply the optimum economic nitrogen rate in wheat. • To transfer this knowledge intensive technology into farmers’ fields.
1603 710 814
On-farm Trials 2002-2003 194 250 125 250 125 125 250 142 100 125 0 0
N rich Strip Area Fertilized According to the Sensor N rate Experiment
Yield Potential N Deficient Area N Rich Strip NDVI = 0.31 NDVI = 0.65
246 kgN/ha 6831kg Vs 123 kgN/ha 7068kg 300N 0N No Yield Difference 0 vs 300N Manuel Lopez de Lara
300 kgN/ha Vs 180 kgN/ha No Yield Difference 300 N 0N Don Melquiades
11 tons Chicken Manure Vs. 20 tons Chicken Manure No Yield Difference Union Cajeme Insisted in 150 kg N more Over the 11 tons Chicken Manure Technical Adviser called me and asked me if I was making that recommendation Cesar Valenzuela
Farmer Basal N rate N rate Experiment Sensor Rec. C.Valenzuela 135 N No response 0 L.A. Amaya 150 N No response 0 S. Dabdub 175 N No response 0 J. Castro 100 N No response 0 E. Pablos 0 N 200 N 0 M. Lopez de Lara 150N No response 0 J. Felix Sacos No response 0 E. Olea 100N Lost 0 On-farm Trials for Validation of the Sensor
N Rich Strip N Rich Strip
246 kgN/ha 6831kg Vs 123 kgN/ha 7068kg 300N 0N No Yield Difference 0 vs 300N Manuel Lopez de Lara