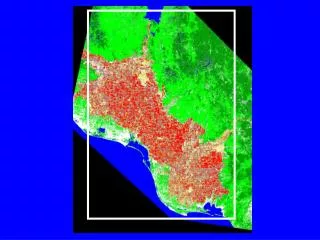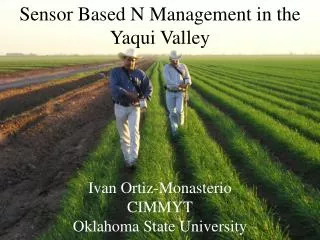
Sensor Based N Management in the Yaqui Valley
460 likes | 650 Vues
Sensor Based N Management in the Yaqui Valley. CIMMYT Oklahoma State University. Yaqui Valley. Percentage Nitrogen Recovery in Wheat in the Yaqui Valley (average of 30 fields). Recovery by the plant. Losses. Losses to the environment. N 2 O. N 2. NH 3. NOx. Urea. NH 4 +. NO 3 -.

Sensor Based N Management in the Yaqui Valley
E N D
Presentation Transcript
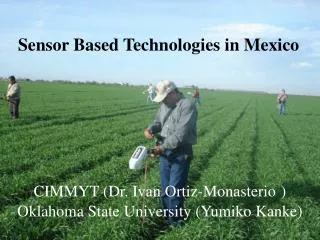
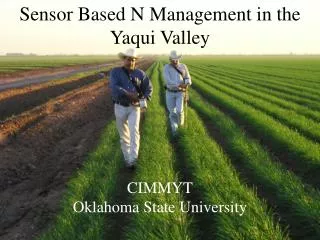
Sensor Based N Management in the Yaqui Valley CIMMYT Oklahoma State University
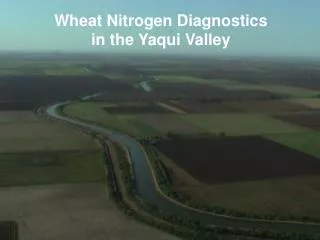
Percentage Nitrogen Recovery in Wheat in the Yaqui Valley (average of 30 fields) Recovery by the plant Losses
Losses to the environment N2O N2 NH3 NOx Urea NH4+ NO3- Organic Matter NH4+ NO3- N2O N2 Nitrification Denitrification
Beman et al. 2005 Nature
Yaqui Valley Ten Year Average Wheat Yield 6.0 t/ha (~90 bushels/acre)
Cumulative nitrogen absorption curve in wheat 250 kgN/ha Farmer’s management 25% 0% 75% Fertilization
Urea or NH3 180 kg N /ha Pre-plant
NH3 70 kg N /ha First post-plant irrigation 45-55 days after planting NH3 Total 250 kgN/ha
Soil residual nitrogen in Farmers’ Fields in the Yaqui Valley Crop cycle 96-98 soil Farmers’ Fields
Sensor TechnologyGreenSeeker Diagnostic tool that allows you to identify the optimum N rate for each individual farmer’s field
Technology Components • Establishment of an N rich strip • NDVI reading in the N rich strip and farmer’s field that will be diagnosed • Use of a crop algorithm to derive N recommendations
N Rich Strip Apply pre-plant or at planting 20 has 10 meters
2. NDVI reading in the N rich strip and the farmer’s field that will be diagnosed Measurement: As close as possible to the first post plant irrigation but 40 days after planting.
RESULTS 2009-2010
TECHNOLOGY TRANSFER IN SONORA • CIMMYT • Oklahoma State University • AOASS • PIEAES • FUNDACION PRODUCE SONORA / COFUPRO • FIRA • SAGARPA • CONACYT • Uniones de Agricultores
TECHNICAL TEAM CIMMYT Dr. Ivan Ortiz-Monasterio Ing. Maria Elena Cardenas
N Rich Strip Sensor Management Sensor Management 107 fields
PROGRAM 2009-2010 • 7363 hectares • 38% tested • 105 participating • farmers • 316 field with an • N rich strip
107 Fields Difference 85 kg N/ha 64kgN/ha
60-68 kgN 86 60 101 107 fields
N Saving Using the GreenSeeker • 2007-2008 • 60 kgN/ha • 1.00 USD/kgN = 60 USD/ha • 2008-2009 • 68 kgN/ha • 1.30 USD/kgN = 88 USD/ha • 2009-2010 • 64kg N/ha • 1.00 USD/kgN = 64 USD/ha
WHEAT 1 2 3 5 7 4 6 8 9 1: B.C. 2: Sonora 3: Sinaloa 4: Jalisco 5: Guanajuato 6: Edo. México 7: Querétaro 8: Tlaxcala 9: Puebla
MAIZE 1 3 2 5 14 7 4 1: Sonora 2: Sinaloa 3: Chihuahua 4: Jalisco 5: Zacatecas 6: Edo. México 7: Hidalgo 8: D.F. 9: Tlaxcala 10: Puebla 11: Oaxaca 12: Chiapas 13: Tabasco 14: Yucatán 15: Quintana Roo 15 6 9 8 10 13 11 12
Ten nitrogen experiments over four years Treatment Preplant N (kg/ha) Starter N (kg/ha) Sidedress N (kg/ha) V6 1 0 0 0 2 200 0 0 3 0 40 0 4 0 40 30 5 0 40 60 6 0 40 90 7 0 40 120 8 0 40 150 9 0 40 180
China Pakistan India Source: D. Hodson
Spring wheat INSEY Yaqui vs Pakistan Pakistani data: Dr. Imtiaz Husain
Spring wheat INSEY Yaqui vs India Indian data: Dr. Ramesh K. Sharma
Spring wheat INSEY Yaqui vs Mexicali Mexicali Data: Dr. Jesus Santillano