Sensor-Based Approaches for Cotton Nitrogen Management
370 likes | 523 Vues
This outline presents advanced sensor-based approaches for effective nitrogen management in cotton cultivation, focusing on the integration of real-time data to enhance yield potential. The 2008 sensor projects highlight methods for relating sensor readings to nitrogen application rates, drawing upon core data collection from USDA and NASS. It discusses the implications of over-application of nitrogen and the significance of managing growth stages. Several algorithms and studies from various states offer insights into optimizing nitrogen use efficiency, ultimately aiming for sustainable and profitable cotton production.

Sensor-Based Approaches for Cotton Nitrogen Management
E N D
Presentation Transcript
Outline • Introduction • 2008 Sensor Projects • Sensor-based approaches to manage nitrogen • Core data collection
Cotton Belt USDA, NASS
Cotton and Nitrogen • Perennial plant managed as annual • Indeterminate flowering pattern • 50 lbs N – per lint bale (1 bale = 480 lbs) • Over-application of N: • Energy partition to vegetative vs. reproductive development • Large plants prevent efficient harvest • Growth regulators applied to control vegetative development
2008 Sensor Projects + other sensor + other sensor + other sensor + other sensor custom sensor
Sensor-Based Approaches Relate yield potential with sensor readings and a well fertilized nitrogen plot Direct regression relationship between sensor reading compared to a reference nitrogen plot A growth stage specific relationship between the sensor reading and N rate Relationship between historic yield, soil type and the sensor reading
Relate yield potential with sensor readings and a well fertilized N plot
SBNRC AlgorithmOSU – Arnall et al. • N Rate = (YP0 * RI – YP0) * %N / NUE • potential cotton lint yield, kg/ha = 235.96 e 2216.2 * INSEY • cotton lint yield, kg/ha = 177.41 e 2216.2 * INSEY • Where: • Yield Prediction Model: YP0 = 235.96 e 2216.2 * INSEY • Response Index: RI = 1.8579 * RINDVI – 0.932 • %N = 0.09 • Nitrogen Use Efficiency: NUE = 0.50
LSU AgCenter Implementation of OSU approach (Tubana et al.) • Initiated in 2008, 3 sites in North Louisiana • Growth stage: two weeks after early bloom • INSEY is defined as NDVI divided by the number of days from planting to sensing
LSU AgCenter Implementation of OSU approach (Tubana et al.) • This study also consider the impact of PGR (applied at early bloom) on the yield relationship.
Clemson Modification of OSU Approach (Khalilian et al.) • Soil specific yield by INSEY relationships (soil electrical conductivity categories) • Coastal plain soils of South Carolina • INSEY was calculated as days from emergence to date of sensing.
Direct regression relationship between sensor reading compared to a reference nitrogen plot
Missouri (Scharfet al.) • Best-band-ratio predictor of economically optimal nitrogen rate
Missouri (Scharf et al.) • Calculating N rate based on NDVI and refNDVI: • Crop Circle 210: N rate (lb/ac) = 573 - [549 x (NDVI/refNDVI)] • GreenSeeker: N rate (lb/ac) = 760 - [732 x (NDVI/refNDVI)] • Cropscan: N rate (lb/ac) = 691 - [673 x (NDVI/refNDVI)] • Ceilings on total N rate are use: • 200 lbs N/ac for heavy soils (clay, clay loam) • 150 for other soils • Farmers decide on lowest and highest N rates for the system (within the ceiling)
A growth stage specific relationship between sensor readings and N rate
Mississippi (Varco et al.) • Relationship between GNDVI or NDVI at a specific stage of growth and fertilizer N rate • Leaf N approach (graph): Utilize N rates to that produce leaf N values at various physiological stages
Mississippi (Varco et al.) • Example of established relationship at the third week of squaring (experimental data): Fertilizer N rate equivalence (FNRE) = -999.562 + 1584.984(GNDVI or NDVI on-the-go value) • Variable N rate = FNRE (experimental data) – target rate • Ceilings on total N rate (cutoff values)
Relationship between historic yield, soil type, and sensor readings
Tennessee (Wilkerson et al.) • Bracket the response of real-time nitrogen prescription algorithms • Incorporate a map of historic information: identify areas within a field as historically low or high yielding and increment/decrement the N prescription accordingly • Additional agronomic data to determine the size of increment or decrement in response to yield potential is needed.
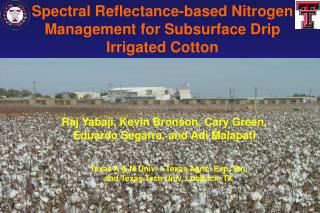
Texas (Sui et al.) • Canopy chlorophyll content index (CCCI) – relative estimate of the chlorophyll content in a crop canopy • CCCI accounts for variation in canopy density and less likely to give false indications of low chlorophyll content (vs. simple ratio or NDVI) • Well-suited for the three-band sensor (Crop Circle)
Core Data Collection • Develop a simplified yield potential nitrogen rate estimate – under discussion. • Producer usable approach - 2010
Core Data Collection Growth stages for plant data collection: Early squaring: 3 to 7 squares Early bloom: 2 to 3 blooms Mid bloom Peak bloom Nitrogen rates: 0, 90, and 120 lb N/ac
Core Data Collection Soils data set (Mehlich-3 P & K, soil NO3) Preplant samples Post-harvest samples
Core Data Collection Within season plant information: Sensor readings
Core Data Collection Within season plant information: SPAD readings and plant height Tissue samples for leaf N
Hand harvest – 13.3 ft of row Machine – 40 feet of 2 rows Determine seed cotton and lint weight Seed N content Yield Data Collection
Other Record Keeping Varieties Planting and harvest dates Nitrogen rates, timing, application methods and N sources PIX rates and dates (if applicable) Irrigation amounts (indicate in furrow, pivot, drip) Rainfall
Take Home Notes • One or more of these approaches should be ready for extended on-farm evaluation in 2010. • Will this end with one concept: analysis of core data: • correction procedures (thermal time, days from planting to sensing etc.) • components (yield potential, response index, simple ratio)