Download
1 / 26
260 likes | 376 Vues
This paper discusses the implementation of sensor-based variable rate nitrogen (N) management in Mid-Atlantic corn and wheat cropping systems. It highlights techniques for calculating optimal nitrogen application rates based on realistic yield goals, utilizing pre-sidedress nitrate tests, and recommending split applications. The discussion includes validations of nitrogen fertilization algorithms developed for both crops, emphasizing research conducted across Virginia, Maryland, and Delaware. The future of N management in these regions is also addressed, focusing on improving efficiency and environmental sustainability.

E N D
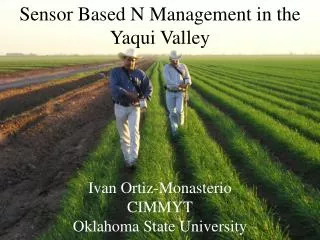
Sensor Based Variable Rate N Management in Mid-Atlantic Cropping Systems Joshua M. McGrath, UMD Wade Thomason, VT Steve Phillips, IPNI
Corn: Apply N based on realistic yield goal 1 lb N/bu expected yield Split-apply N fertilizer on corn apply 30 – 40 lbs/A at planting remaining N as sidedress When utilizing manure or following leguminous cover crops use the Pre-Sidedress Nitrate Test Wheat: Apply a total 70 – 120 lbs of N 20 – 40 lbs at planting Split top-dress 80 – 100 Green-up Feekes 5 - 6 Nitrogen Management Basics(since early 1990s in MD)
What makes us special? • >90% side-dress N in Corn on Delmarva • Yields vary widely 120 – 220 bu/ac • >90% no-till corn • 50 – 60% irrigated on the lower shore • In Maryland farmers cannot exceed University recommendations
VIRGINIA APPROACH • Generated calibration models for wheat and corn grown in the Mid-Atlantic • Developed N fertilization algorithms for both crops • Validated these rate equations for performance
7 6 5 4 3 2 1 0 0 0.001 0.002 0.003 0.004 0.005 0.006 0.007 VIRGINIA APPROACH • Generated calibration models for wheat and corn grown in the Mid-Atlantic 7 6 5 1 - 4 Yield, Mg ha 3 2 1 0 0 0.001 0.002 0.003 0.004 0.005 0.006 0.007 Predicted Yield Index
VIRGINIA APPROACH • Generated calibration models for wheat and corn grown in the Mid-Atlantic YPI
What’s Needed Reference Strips Difference between: High N reference (best possible with more than adequate N) Low N reference (0 N applied) And Area currently in sensor’s view.
In-season N management 2nd topdress based on Tissue N concentration 1st topdress based on estimated tiller # 30 to 40 lb N/ac preplant
In-season N timing 2nd topdress based on NDVI and DFP 1st topdress based on estimated tiller # Days From Planting Zadoks stage, in parenthesis
~60 sites across Virginia since 2000 12 sites in DE and MD (2008, 2009) Irrigated and non-irrigated Conventional and no till Various rotations, hybrids, varieties, and soil types Wide range of pre-plant, starter, and in-season N rates (including VR) Collected spectral measurements and an assortment of plant physical and chemical characteristics at various growth stages Determine grain yield Validation in VA, MD, DE
Validation in VA, MD, and DE • RCBD; 3-8 reps • Plot size: 60 by 250 to 500 ft • In-season N: • 4-5 Fixed Rates • 1 Standard Rate • 1 Variable Rate Spra Coupe 220 w/ 60 ft boom and GreenSeeker RT200 Raven 440 flow rate controller
Recommended vs. Applied Rates • 55% are within 2 gallons of prescribed rate • 88% within 5 gallons
Wheat: Applied N GreenSeeker vs. Tissue 100 90 80 70 60 50 N rate, kg ha-1 40 30 20 10 0 GS GS GS GS GS GS GS GS GS GS GS GS GS GS GS GS GS STD STD STD STD STD STD STD STD STD STD STD STD STD STD STD STD STD 1 2 3 4 5 6 7 8 9 10 11 12 13 14 15 16 AVG
Average Wheat Performance 100 NS 90 Farmer Practice 80 GS 7% less N with GS 70 60 Farmer Practice GS 50 40 30 20 10 0 Grain Yield, bu/ac GS 30 N Rate Applied, lb/ac
120 100 80 STD 60 N Rate, lb/ac GS 40 20 0 1 2 3 4 5 6 7 8 9 10 11 Corn Algorithm Performance
Average Corn Performance NS 160 140 120 21 % (21 lb/ac) less N with GS 100 STD 80 GS 60 40 20 0 Grain Yield, bu/ac Sidedress N, lb/ac
Limitations and Challenges • Corn: V-7 versus V-4 • Wheat: Herbicide in second spring top-dress? • Check strips • How to tell if the system was “right” – Skepticism • When parameters are entered the application graph often needs tweaking by faking parameters
N_pre = 0 This has been corrected in the software Can’t just plug and chug (spray) Farmer would apply 46 gal/acre
Part of the Adaptive Management Toolbox • Systems approach • Manage soil N • Focused on in-season N management • PSNT • Active Crop sensors • LCM • End of season assessment • CSNT • Yield monitoring
The Future in the Mid-Atlantic • The Chesapeake Bay and cost of fertilizer have us poised for rapid adoption • A few major farmers and ag service companies • Environmental Groups • Likely to be covered through various cost share mechanisms soon • Need to continue to refine algorithm to address • Accuracy of input values • Expand side-dress window • Straightforward user interface