Optimizing NBA Scheduling for Revenue and Player Well-being
This analysis explores the complexities of scheduling 1,230 NBA games over 176 days, revealing issues like player and fan dissatisfaction due to inefficiencies. The aim is to optimize the league’s revenue while minimizing team fatigue and travel distance. Using a sophisticated model with 162,000 variables, the study identifies key constraints, including game frequency, and the impact of scheduling on earnings. Initial findings show potential revenue increases, outlining a trade-off between financial performance and player health.

Optimizing NBA Scheduling for Revenue and Player Well-being
E N D
Presentation Transcript
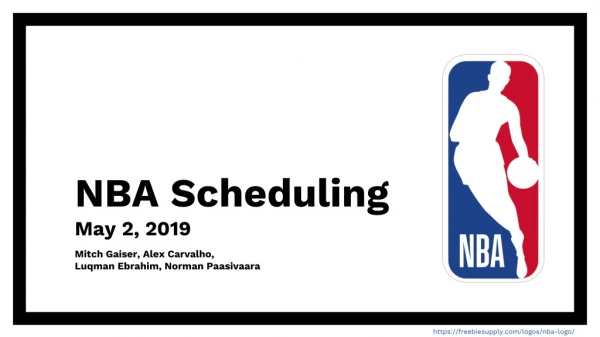
NBA Scheduling May 2, 2019 Mitch Gaiser, Alex Carvalho, Luqman Ebrahim, Norman Paasivaara https://freebiesupply.com/logos/nba-logo/
Introduction • NBA schedules 1230 games in 176 days • Revenues total $2.6 bn • Inefficiencies create • Lost Revenue Opportunities • Player dissatisfaction • Fan dissatisfaction
Initial Ideas • Create an LP with team fatigue and fan penalty • Maximize Revenue for NBA • Minimize Fatigue (back-to-back games) • Minimize travel distance • 162,000 Variable matrix • Very hard to optimize • Massive computing power
The Model Definitions = 1 if team i plays team j on day d; 0 otherwise. → i = 1,...,30; j = 1,...,30; d = 1,...,180. = objective coefficient value if team i plays team j on day d. → comes from team-viewership data and importance of day. represents the number of games team i plays in week w Each team i is in Conference Set SC ; where C = 1 or 2 Each team i is in Division Set SD ; where D = 1, 2, 3, 4, 5, or 6
The Model subject to: Teams can only play once per day No games during all-star break, Christmas Eve and Thanksgiving Each team plays 82 total games At most five games on Christmas Day Teams in opposing conferences play twice At most 2 games on Opening Day Teams in the same conference play at most 4 times Weekly variable definition Teams in the same division play exactly 4 times At most 4 games per week for all teams Total number of scheduled games is 1,230 At least 1 games per week for all teams
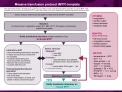
The Greedy Algorithm while (all teams haven’t played 82 games) { for (weight-sorted days in the schedule) { choose the objective maximizing game on that day if (the game is schedulable) { schedule it decrease objective coefficients for d-1 and d+1 } else { set objective coefficient for team-team-day combination = 0 } } }
Interesting Finds: Opening Day
Interesting Finds: Christmas Day
25 Exactly matched games Interesting Finds:
Evaluation First Iteration Schedule • 7% increased TV revenue over NBA • $180M “improvement” • However, on average 35 back-to-back games • Slightly less total travel distance as real schedule New Schedule (B2B penalty) • 5% increased TV revenue over NBA • $130M “improvement” • Reduction to average of 25 back-to-back games • Slightly less total travel distance as real schedule
Conclusion • Tradeoff between revenue and player comfortability • Difficulty balancing different objectives • NBA likely not optimizing for revenue • Optimizing for additional constraints such as rest, travel time or cost
Further exploration Additional Inputs • Better Revenue Model • Broadcasting availability and constraints • Home and Away optimization Methodology • Different or added objective (travel time, rest etc.) • Improved Heuristic