Download
1 / 8
80 likes | 91 Vues
Phytoplankton Biodiversity: Role in the Carbon Cycle and Climate Change Tiffany A Moisan (610.W), John R. Moisan (610.W), Matthew Linkswiler (URS), and Rachel Steinhardt (Sigma Space).

E N D
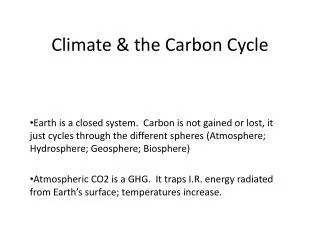
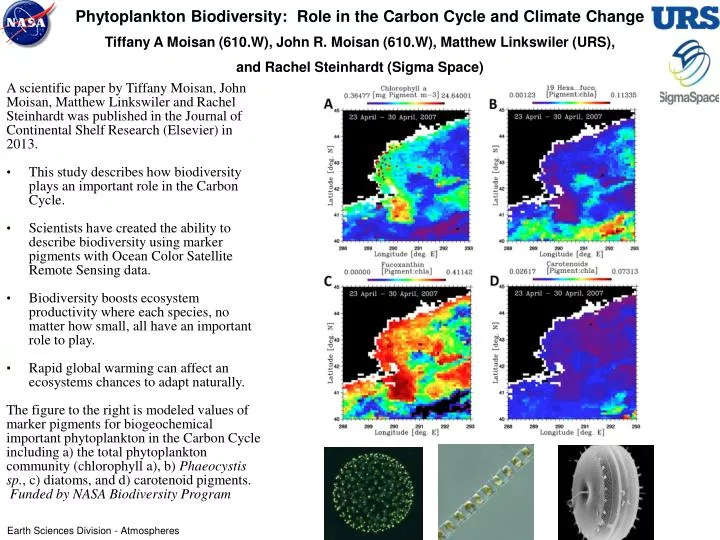
Phytoplankton Biodiversity: Role in the Carbon Cycle and Climate ChangeTiffany A Moisan (610.W), John R. Moisan (610.W), Matthew Linkswiler (URS), and Rachel Steinhardt (Sigma Space) • A scientific paper by Tiffany Moisan, John Moisan, Matthew Linkswilerand Rachel Steinhardt was published in the Journal of Continental Shelf Research (Elsevier) in 2013. • This study describes how biodiversity plays an important role in the Carbon Cycle. • Scientists have created the ability to describe biodiversity using marker pigments with Ocean Color Satellite Remote Sensing data. • Biodiversity boosts ecosystem productivity where each species, no matter how small, all have an important role to play. • Rapid global warming can affect an ecosystems chances to adapt naturally. • The figure to the right is modeled values of marker pigments for biogeochemical important phytoplankton in the Carbon Cycle including a) the total phytoplankton community (chlorophyll a), b) Phaeocystissp., c) diatoms, and d) carotenoid pigments. • Funded by NASA Biodiversity Program Earth Sciences Division - Atmospheres
Name: Tiffany A.H. Moisan E-mail: tiffany.a.moisan@nasa.gov Phone: 757-824-1046 References: T.A. Moisan, K. Blattner, and CP Makinen (2010). Influences on Picocyanobacteria abundance and biomass in the southern mid-atlantic Bight. Journal of Continental Research 30, Issue 12: 275-1282. Tiffany A.H. Moisan, ShubhaSathyendranath and Heather A. Bouman. Ocean Color Remote Sensing of Phytoplankton Functional Types. Remote Sensing of Biomass, to be submitted in July. Editor: L. Fatayinbo (publication in press 2012). Tiffany A. Moisan, Patrick Neale, and Joaquim Goes. 2009. In Marine Phytoplankton. (Oceanography and Ocean Engineering) Editors William T. Cursey and Samuel P. Munger. 382 pp. Data Sources: The goal of the study was to develop algorithms for understanding the ocean’s ecosystem with Ocean Color SeaWiFs and MODIS Data. Phytoplankton serve as the base of the food web in the ocean. Phytoplankton are responsible for approximately 50% of the total global photosynthesis. Understanding carbon linkages within the food web require a fundamental understanding of the Ocean’s dynamics. Understanding phytoplankton community structure is key to understanding Climate and its effects on the ecosystem. Technical Description of Figures: Figure : Maps of predicted phytoplankton chlorophyll a (A, mg m-3) and pigment to chlorophyll a ratios for 19’hexanoyloxyfucoxanthin (B, mg m-3), fucoxanthin (C, mg m-3) and total carotenoids (D, mg m-3) using phytoplankton absorption spectra modeled using Algorithm I with satellite-derived estimates of PAR, SST and chla from SeaWiFS as inputs into the Algorithm II-b NNLS to estimate pigment concentrations for the Gulf of Maine region. This algorithm predicts total phytoplankton community, Phaeocystis, diatoms, and a physiological indicator for carotenoids. Scientific significance: The link between climate change and biodiversity has long been established. Climate change is already having an impact on biodiversity, and is projected to become a progressively more significant threat in the coming decades. Loss of Arctic sea ice threatens biodiversity across an entire biome and beyond……… In addition to warming temperatures, more frequent extreme weather events and changing patterns of rainfall and drought can be expected to have significant impacts on biodiversity. — Secretariat of the Convention on Biological Diversity (2010), Global Biodiversity Outlook 3, May, 2010 Relevance for future science and relationship to Decadal Survey: The PACE mission will make global ocean color measurements to provide extended data records on ocean ecology and global biogeochemistry (e.g., carbon cycle) along with polarimetry measurements to provide extended data records on clouds and aerosols. Understanding of impacts and feedbacks of the Earth system to climate are critical importance. Biodiversity is key to understanding these processes. Earth Sciences Division - Atmospheres
Minimum Precipitation Rates Detectable By GPMS. Joseph Munchak, Code 612, NASA GSFC and University of Maryland/ESSIC Gail Skofronick-Jackson, Code 612, NASA GSFC • What is the minimum precipitation rate that NASA’s Global Precipitation Measurement (GPM) satellite and constellation of sensors will be able to detect? To answer this question, we compared data from the Department of Defense’s Special Sensor Microwave Imager/Sounder (SSMIS) sensor, which has similar channels to GPM’s microwave imager (GMI) and other constellation sensors, to NOAA’s National Mosaic and Quantitative Precipitation Estimate (NMQ) ground radar-based precipitation product. Findings include: • The minimum detectable rate varies by sensor and surface type, but is generally between 0.25 and 1 mm/hr. • Oceans and bare ground have the smallest detectable rates, followed by snow covered ground and coastlines. • Detection can be improved if ancillary data regarding atmospheric temperature and water vapor profiles and snow cover status are used. Figure 1: Ground mosaic surface reflectivity from a winter storm on 8 December 2009 is overlaid with precipitation detection (hatched area) from an SSMIS overpass. Figure 2: Relative precipitation detection skill over various surfaces and impact of ancillary data regarding atmospheric temperature and water vapor profiles (from MERRA) and snow cover (from SNODAS) is shown for four passive microwave sensors: TMI, GMI, AMSU, and MHS. Earth Sciences Division - Atmospheres
Name: S. Joseph Munchak, NASA/GSFC, Code 612 and University of Maryland/ESSIC • E-mail: s.j.munchak@nasa.gov • Phone: 301-286-2392 • References: • S. Joseph Munchak, Gail Skofronick-Jackson: Evaluation of precipitation detection over various surfaces from passive microwave imagers and sounders, Atmospheric Research, Available online 1 November 2012, ISSN 0169-8095, doi:10.1016/j.atmosres.2012.10.011. • Data Sources: • DMSP SSMIS (passive microwave data), • NOAA NMQ (ground radar reflectivity and precipitation rate), • NASA MERRA (temperature and water vapor profiles), • NSIDC SNODAS (snow depth and water content). • Technical Description of Figures: • Figure 1: The basemap radar reflectivities come from the NOAA NMQ data on 8 December 2009 at 2310 UTC. Precipitation type was determined from MERRA temperature profiles. The contour overlay represents the precipitation detection threshold that corresponds to a precipitation rate of 0.25 mm/hr. Note that some regions of snowfall over the upper Midwest are missed at this threshold, while some false detection (associated with snow covered ground) is evident over western Nebraska and North Dakota. Changing the threshold can result in detection of lighter precipitation rates, but at the expense of more false detections. • Figure 2: The Heidke Skill Score (HSS) is a metric that weighs correct detections, false alarms, misses, and correct rejections to assess the detection skill relative to random guessing weighted by climatology. A value of 1 is perfect while 0 indicates no skill. HSS values are shown for each sensor, grouped by surface type, and with different ancillary data used at input. Some notable points from the figure: • Over ocean, sounders (AMSU and MHS) and imagers (TMI and GMI) perform equally well when atmospheric ancillary data is used, but over land, coast, and snow, the sounding channels provide extra information to discriminate precipitation from these ambiguous surfaces. • Sounders benefit more from atmospheric data than imagers since they are sensitive to water vapor and temperature profiles. • Knowledge of snow cover improves all sensors’ precipitation detection skill over snow cover by reducing false alarms (snow on the ground produces a similar passive microwave signal to falling snow, particularly when sounding channels are not available). • Scientific significance: The GPM core satellite, in conjunction with a constellation of microwave sensors from international partners, will provide instantaneous precipitation estimates over 90% of the globe with a 3-hour or less revisit time. This research assesses the relative quality of the various sensors that will comprise this constellation. • Relevance for future science and relationship to Decadal Survey: This study highlights areas where precipitation detection skill is still lacking, particularly over coasts and snow-covered surfaces and at light rates. For future missions to improve detection, this research suggests that additional sounding channels (in the 50-60 GHz and 118 GHz oxygen bands) along with active sensors will be useful. Earth Sciences Division - Atmospheres
Aerosol indirect effect on tropospheric ozone via lightningTianle Yuan, L. A. Remer, H. Bian, J. Ziemke, R. Albrecth, K. Pickering L. Oreopoulos, S. Goodman, H. Yu, D. Allen, Code 613, NASA GSFC Human activity has increased the concentration of aerosols in the atmosphere. These tiny air-borne particles can act as cloud condensation nuclei and changes in their concentration can therefore affect cloud development. In this study (Yuan et al., 2012) and a previous study (Yuan et al., 2011) we found unequivocal evidence that aerosols increase lightning activity of convective clouds. The rate at which lightning increases with aerosols is remarkable: lightning flash rates can increase up to 30 times per unit of aerosol optical depth. Lightning flash rate increases produce more ozone precursors such as nitrogen oxides (NOx), particularly in the upper troposphere. Since NOx in the upper troposphere is normally insufficient for active ozone production, lightning induced NOx helps boost tropospheric ozone production in that part of the atmosphere, where ozone is a potent greenhouse gas. Thus, ultimately anthropogenic aerosol increase leads to more production of tropospheric ozone in the upper troposphere via increasing lightning. Using NASA satellite data and a NASA chemical transport model we were able to demonstrate this chain reaction and show this new aerosol effect. The lightning increase due to aerosols can feedback to biomass burning since in the mid- to high- latitude regions wild fires are primarily initiated by lightning strikes from dry convection. Figure A) MODIS measured aerosol optical depth anomaly; B) Climatology of flash rate; C) flash rate of high aerosol loading year, note the scale is logarithmic; D) rate of increase in flash rate per unit of aerosol optical depth increase. Cartoon: A schematic showing the connection between human activity, aerosols, lightning flash rate and ozone production in the troposphere. Each arrow is pointing to an increase. For detailed results please refer to Yuan et al. (2012) Earth Sciences Division - Atmospheres
Name: Tianle Yuan, NASA/GSFC Code 613 and UMBC/JCET E-mail: tianle.yuan@nasa.gov Phone: 301-614-6195 References: Yuan. T., L.A. Remer, K.E. Pickering, and H. Yu (2011), Observational evidence of aerosol enhancement of lightning activity and convective invigoration, Geophys. Res. Lett. Yuan T., L.A. Remer, H. Bian, R. Albrecht, J. Ziemke, K. Pickering, L. Oreopoulos, S. Goodman, H. Yu, D. Allen, Aerosol indirect effect on tropospheric ozone via lightning, in press, J. Geophys. Res-Atmos., 2012. Data Sources: MODIS Level 2 Aerosol and Cloud products, OMI SO2 and tropospheric ozone data, OMI NO2 product, TRMM lightning product, NASA GMI chemical transport model, SCIAMACHY NO2 product, GOME NO2 product, MERRA reanalysis data sets. Technical Description of Figures: Figure 1: Aerosol increase due to human activity or climate change can alter cloud microphysics and macrophysics in a profound way. One of the potential outcomes is significant increase in lightning flash rate, which leads to more production of ozone precursors such as NOx. Increased ozone precursors boost tropospheric ozone production. In addition, more lightning strikes can potentially increase the chance of wildfires, creating a positive feedback loop. Under a climate change scenario, it can also be envisioned that dry extremes may increase biomass burning and aerosol concentration, which will subsequently increase tropospheric ozone production, ergo, another potential feedback loop. Scientific significance: Our results for the first time demonstrate that there is a link between aerosol, lightning and tropospheric ozone via cloud microphysical processes. Such a link would suggest a missing component of ozone forcing and aerosol indirect forcing. This link also has implications for biomass burning activity, lightning variability and future climate change. Relevance for future science and relationship to Decadal Survey: Aerosol-cloud-precipitation interactions are a key set of unresolved processes in our understanding of the climate system. They are also a critical component of the Decadal Survey and a major goal for future NASA missions. Earth Sciences Division - Atmospheres
The 2012 Antarctic Ozone Hole • Natalya Kramarova, Eric Nash SSAI • Paul Newman, Code 610, NASA GSFC • Pawan Bhartia, Richard McPeters, Code 614, NASA GSFC First results from the OMPS Limb Profiler launched in October 2011 showing the evolution of the 2012 Antarctic ozone hole. Total ozone near the center of the ozone hole declined throughout September of 2012 (Fig. 1a) as ozone values were depleted in the 15-22 km layer to values less than 1 ppmv (Fig. 1b). This depletion greatly sharpened the vertical ozone gradient at 22 km by October 1. The ozone concentration in the lower stratosphere reached a minimum about two weeks after the minimum in total column ozone (Fig. 1b). Total column ozone began to increase after October 1 (Fig. 1a) because of the descent of high ozone concentrations to lower altitudes. These results demonstrate the ability of the OMPS Limb Profiler to detect strong variations in the ozone vertical distribution. The data will be used to continue monitoring the Earth’s ozone layer and to improve understanding of the vertical ozone distribution, particularly in the lower stratosphere. Figure 1: Daily time series of satellite ozone measurements near the center of the Antarctic Ozone Hole during the SH spring of 2012 (September-November). Panel (a) is the time series of total ozone values (DU) observed by OMPS Total Column Mapper showing ozone depletion in September and its gradual recovery in October and November. Panel (b) shows the evolution of the ozone vertical distribution (ppmv) measured by the OMPS Limb Profiler in the middle and lower stratosphere. In October, while the ozone concentration in the lower stratosphere continues to decline, a strong ozone build-up occurs in the middle stratosphere. Sharp vertical gradients caused by the ozone loss are observed between 20 and 25 km. Earth Sciences Division - Atmospheres
Name: Natalya Kramarova, NASA/GSFC, Code 614 and SSAI E-mail: natalya.a.kramarova@nasa.gov Phone: 301.614.5115 References: McPeters, R.D., S.J. Janz, E. Hilsenrath, T. L. Brown, D. E. Flittner and D. F. Heath: “The retrieval of O3 profiles from limb scatter measurements: Results from the Shuttle Ozone Limb Sounding Experiment” ,Geophysical Research Letters, v. 27, N17, pp. 2597–2600, DOI: 10.1029/1999GL011342, 2000. Flittner, D. E., B.M. Herman, P. K. Bhartia: “O3 profiles retrieved from limb scatter measurements: Theory”, Geophysical Research Letters, v. 27, N17, pp. 2601–2604, DOI: 10.1029/1999GL011343, 2000. Newman, P. A., E. R. Nash, S. R. Kawa, S. A. Montzka, and S. M. Schauffler: “When will the Antarctic ozone hole recover?”, Geophysical Research Letters, v.33, L12814, DOI: 10.1029/2005GL025232, 2006. Acknowledgements: Richard S. Stolarski (Research Professor, John Hopkins University), Stacey M. Frith (SSAI) and Ghassan Taha (USRA). Data Sources: Total ozone columns (DU) from the Suomi OMPS Total Column Mapper, version 1.0; Ozone volume mixing ratios (parts per million by volume, ppmv) from the OMPS Limb Profiler, version 1.0; GMAO MERRA potential vorticity data (used to define the location of the center of the polar vortex and ozone hole). Technical Description of Figures: Figure 1: Suomi OMPS ozone observations from a location chosen near the center of the polar vortex. The polar vortex is defined by GMAO MERRA potential vorticity on the 460 K potential temperature surface. During the vortex split in early November, the "blob" of vortex air that maintained itself the longest was followed. Daily time series of a) total column ozone (in DU) from the OMPS Total Column Mapper and b) ozone profiles (ppmv) from the OMPS Limb Profiler near the center of the polar vortex. Scientific significance: Presently we have a good understanding of the distribution and behavior of total column ozone. However, our knowledge of the vertical ozone distribution, is limited, particularly in the lower stratosphere. The new OMPS Limb Profiler combines the high vertical resolution of occultation-type instruments with the high spatial coverage of nadir-type instruments. Data from the OMPS Limb Profiler will advance our knowledge of the ozone vertical distribution and help to understand past trends in the vertical ozone profiles. As a result, the predictive capability of future ozone changes will be highly improved, which is important in policy-making activities for society. Relevance for future science and relationship to Decadal Survey: The data from the OMPS Limb Profiler corresponds to the goal outlined in the 2011 NASA Strategic Plan, Objective 2.1.1: “Improve understanding of and improve the predictive capability for changes in the ozone layer, climate”. Earth Sciences Division - Atmospheres