Pavlodar Region
150 likes | 334 Vues
Pavlodar Region. The region is located in the north of the country . As of January 1, 2012, the area is 124 . 8 thousand square kilometers, the region's population is 747 . 1 thousand people . Density of population over the region for 1 km area is 6 . 0 people .

Pavlodar Region
E N D
Presentation Transcript
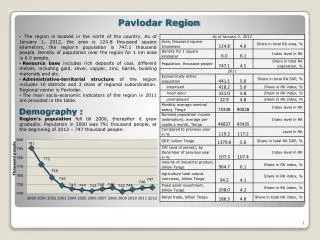
Pavlodar Region • The region is located in the north of the country. As of January 1, 2012, the area is 124.8 thousand square kilometers, the region's population is 747.1 thousand people. Density of population over the region for 1 km area is 6.0 people. • Resource base includes rich deposits of coal, different metals, including gold, silver, copper, zinc, barite, building materials and etc. • Administrative-territorial structure of the region includes 10 districts and 3 cities of regional subordination. Regional center is Pavlodar. • The main socio-economic indicators of the region in 2011 are provided in the table. Demography : Region's population fell till 2006, thereafter it grew gradually. Population in 2000 was 791 thousand people,at the beginning of 2012 – 747 thousand people: 1
Economically active population (EAP) • The number of employed population increases and unemployed population falls in both absolute and relative terms. For 10 years, from 2001 to 2011, the employed population increased from 91 to 95%, while the number of unemployed people fell from 9 to 5%. • Characteristic feature of the employed population dynamics is the growth of hired labor and the reduction of self-employed people. From 2001 to 2011 the number of hired labor increased from 57% to 77%, the number of self-employed people fell from 43 to 3%. EAP structurecorresponds to the medium level in Kazakhstan: EAP has been increasing since 2006, despite the region’s population decrease, and in 2011 it was 441.1 thousand people, however, didn’t reach the level of 2001 (449.9 thousand people). 418.2 thousand people of them are employed, 22.9 thousand people are unemployed.Economically inactive population is falling andmakes up 160.5 thousand people, it is below the level of 2000:
The changes of employed population structure are supported by a strong tendency of unemployment rate reduction from 13.8% in 2000 to 5.2% in 2011 and an increase in economic activity of the population: • In 2011 unemployment rate of the region was below the average in Kazakhstan – 5.4%: Unemployment Level
Quality of Life • Cost of living has been growing steadily since 2003, but the values are below the average in RK: • Life expectancy at birth is increasing, but the dynamic values are below the average in Kazakhstan in general: • Some life quality indicators in 2011: • Share of population with income used for consumption below the poverty line is decreasing. Values are below the average in RK:
Enrollment • Enrollment share of the population aged 6-24 years has increased from 2001, however, it’s below the average in RK: • The number of children in regular preschools has increased since 2001: • The number of students in technical and vocational education was increasing up to 2007, thereafter it started decreasing despite the growth of region’s population: • The number of students in higher educationis not stable and it has decreased since 2009, despite the growth of region’s population:
Monthly average nominal salary per employee for 2011 is 75,338 Tenge, which is below the country’s average – 90,028 Tenge: • In the dynamics the average nominal salary per employee and the average nominal income per capita are ever-growing. • The index of the nominal and real incomes showed a decline during the economic crisis in 2009. At that time the growth of nominal income was lower than the consumer price index, i.e. revenue growth did not cover inflation: Population Income
Despite GRP growth, EKR sharein total GRP of all the regions has decreased from 6.4 % in 2000 to 5.5% in 2011 in the total gross regional product: • However, GRP growth in 2011 is above the average growth of total GRP of all regions of Kazakhstan and makes up 148% compared to 2010, against the total value of RK - 126.4%: Economy
The growth of fixed assets investment in 2011 has exceeded the total levelin RK regions and made up 112% compared to the previous year,against 107.7% in general in RK: • Fixed assets investment tends to a stable significant growth: • The share of fixed assets investment of the region shows little growth since 2008 and made up 4.1% in 2011: Investment
The volume of agriculture production increased until 2009 anddecreased in 2010 to 60.7 billion Tenge: • The share of the region’s volume of production in agriculture in total Kazakhstan’s volume of industry’s production. In 2010 4.2% of country’s agricultural production was manufactured in the region: Agriculture
The growth of industrial production volumes was observed throughout the study period, excluding crisis year 2009, when manufacturing volumes showed a decrease: • Real sector industries showing the highest values of production in 2010 aremetallurgic industry and production of finished metal products, production and distribution of electricity, coal and lignite mining, agriculture, machine industry, etc.These industries have significant share of total production in the Republic of Kazakhstanand region’s GRP: • The share of industrial production in the Kazakhstan’s level fell from 7.3% in 2000 to 6.1% in 2011: Real Sector
Sector Enterprises • The number of industrial enterprises has increased since 2000: • The number of construction companies is increasing: • The number of working agricultural enterprisesand their share in Kazakhstan’s level is not stable:
Small and Medium Business • The number of registered legal entities as of October 1, 2012 is 12665. The SME number is 12561. The structure of the enterprises number is close to the RK average level: • SME share of the region's GRP grows,but it is lower than the average level in RK:
Budget revenues of Pavlodar region in 2011 amounted to 103.8 trillion Tenge, including 51.4 trillion Tenge of transfers from the national budget. Expenses amounted to 100.7 trillion Tenge, including 1.6 trillion Tenge of transfers to the national budget. Thus, the region is subventional: Interbudgetary Relations
Main target indicators: • GRP increase in real terms by 32.4%in 2015 compared to 2009; • An increase of the manufacturing industry share in GRP up to 32%; • An increase of labor productivity in the manufacturing industry by1.6 times in 2015; • An increase of investments in the non-primary sectors of the economy at least by 11.5% in 2015; • An increase of the share of non-resource exports in total exports to 57% in 2015; • An increase of GVA of metallurgic industry based on deep processing of mineral raw materials and creating new processing by 1 .9 times in 2015; • An increase of labor productivity in the metallurgical industry at least by 1.7 times in 2015; • An increase of exports of metallurgic products by1.7 times in 2015; • An increase of coal production to 90.1 million tons; • An increase of the production of chemical products in value terms by 7.2 times in 2015; • GVA growth in machine industry by 77% in 2015; • An increase of labor productivity in the machine industry to 52.4 thousand dollars per person per year in 2015; • An increase of oil refining in real terms by 1.4 times in 2015 ; • An increase of GVA in the construction industry by 1.4 times in 2015 ; • Reduction of GRP energy intensity at least to 10% from the level at 2008; • An increase of the local content share in the procurement of governmental agencies and organizations, strategic enterprises - for the procurement of goods to 60%, services - to 90%; • An increase of labor productivity in the agricultural sector at least by2 times by 2015; • Life expectancy of the population in 2015 - 70.4 years; • Reduction in overall mortality to 8.5 per 1,000 people of the population in 2015 ; • Reduction of unemployment in the open labor market to 5.5%; • Reduction of the share of population with income below theminimum cost of living to 4.7%. Pavlodar Region Development Program for 2011-2015