Download
1 / 8
80 likes | 281 Vues
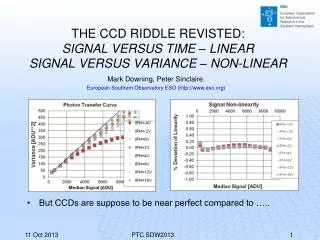
THE CCD RIDDLE REVISTED: SIGNAL VERSUS TIME – LINEAR SIGNAL VERSUS VARIANCE – NON-LINEAR. Mark Downing, Peter Sinclaire . European Southern Observatory ESO (http://www.eso.org). But CCDs are suppose to be near perfect compared to …. Previous results concluded….

E N D
THE CCD RIDDLE REVISTED:SIGNAL VERSUS TIME – LINEARSIGNAL VERSUS VARIANCE – NON-LINEAR Mark Downing, Peter Sinclaire.European Southern Observatory ESO (http://www.eso.org) • But CCDs are suppose to be near perfect compared to ….. PTC SDW2013
Previous results concluded…. “Sharing of electrons” between pixels that increase as more electrons are collected PTC SDW2013
More evidence gathered…PSF PSF linearly degrades with signal. Both value and change with signal improve as 1/collection phase voltage. Y-intersect Slope PTC SDW2013
Mechanism behind “Charge Sharing” between Pixels Undepleted Region Pixel 400nm Collection Phase CCD Front side Electric Field Extent PTC SDW2013
100% agreement between non-linearity in PTC and correlation between pixels Slope Both slope and signal2 term vary with 1/collection phase voltage. Both slope and correlation between pixels vary linearly with signal Slope Signal2 term PTC SDW2013
PTC can be 100% corrected for correlation between pixels by using autocorrelation variance – most accurate method to determine gain PTC SDW2013
On going…… • Confirm that the effect can be predicted by taking two flat fields and by using autocorrelation to calculate the correlation and thus determine the PSF Vs Signal. Corrections can then be applied to image data. • Consult the experts to better understand the cause of the effect and hopefully find a solution. PTC SDW2013
Thank You PTC SDW2013