Download

1 / 12
170 likes | 477 Vues
Linear & Non-Linear Regression. Formerly known in Grade 9 as “Line of Best Fit”. Start with the Bad News…. A little something I have learned about iWork:Numbers …

E N D
Linear & Non-LinearRegression Formerly known in Grade 9 as “Line of Best Fit”
Start with the Bad News… A little something I have learned about iWork:Numbers… regression linesNumbers doesn't support regression analyses, including regression line fitting (called trendlines in Excel) and R2 calculations. (For me, this is a deal breaker as I use this feature every day. I imported a complex and large Excel file containing dozens of worksheets and graphs, and although all worksheets and graphs were properly recognized, the regression lines and regression data from Excel were removed completely without any mention of it in the long import warnings list. ) http://driesknapen.net/blog/iwork-08-numbers-annoyances
Learning Goals So far… • I can use vocabulary related to two variable data including, scatter plots, split-bar graph, dependent variable, independent variable, trend, linear correlation, etc. • I can identify if there is a correlation between two variables, and what type it is (linear, quadratic, etc.) • I can identify the different types of cause and effect relationships that exist. • I can provide an example of a causal relationship, and other relationships that exist. • I can express orally and in writing how split-bar graphs show a causal relationship for qualitative data. • I can create scatter plots to identify relationships between two variables.
Learning Goals Today… • I can identify the type of relationship that exists between two variables (linear, non-linear, no relationship). • I can explain the purpose of the correlation coefficient (r) and the coefficient of determination (r2) in two-variable data. (Today and on-going) • I can be proficient with the TI-83s to create graphs and to determine solutions to problems with two-variable data.
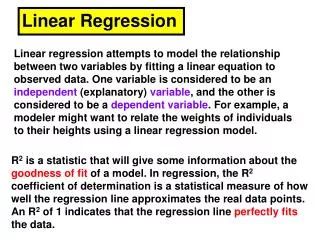
Regression Regression is an analytic technique for determining the relationship between a dependent variable and an independent variable. When the two variables have a linear or nonlinear correlation, we can develop an appropriate mathematical model of the relationship. This model will enable us to predict values that may not have been recorded in our findings.
Example 1 – Linear Regression A university would like to construct a mathematical model to predict 1st year marks for incoming students based on their achievement in grade 12. A comparison of these marks for a random sample of 1st year students is given. • a) Construct a scatter plot for these data. • b) Perform a linear regression of the data and classify the strength of the relationship.
Continued… Making predictions is something that is a general progression for Statisticians. Our goal is to understand the data so well we can make valid predictions for future data. Continuing with our example… Based on the model, determine the 1st year average for a student who had • an 82% average in grade 12. • a 60% average in grade 12.
Example 2: Non Linear Regression For a physics project, a group of students videotape a ball dropped from the top of a 4.0m high ladder, which they have marked every 10 cm. During playback, they stop the videotape every tenth of a second and compile the following table for the distance the ball travelled. • Does a linear model fit the data well? Try a different model to see if you can get a better fit. • Use the equation to predict how far the ball will fall in 5.0 s.
In Class Questions 1. The following table lists the heights and masses for a group of fire department trainees. • Create a scatter plot and classify the linear correlation. • Determine the correlation coefficient and the equation of the line of best fit. • Predict the mass of a trainee whose height is 165 cm. • Predict the height of a 79 kg trainee. Explain any discrepancy between your answer and the actual height of the 79 kg trainee in the sample group.
In-Class Questions • A random survey of a small group of high school students collected information on the students’ ages and the number of books they had read in the past year. • Create a scatter plot for this data and classify the linear correlation as well as its strength. • Determine the correlation coefficient and the equation of the line of best fit. • Identify the outlier. • Repeat part (b) with the outlier excluded. Does removing the outlier improve the linear model? Explain.
In-Class Questions • As a sample of a radioactive element decays into more stable elements, the amount of radiation it gives off decreases. The level of radiation can be used to estimate how much of the original element remains. Here are measurements for a sample of radium-227. • Create a scatter plot for these data. • Use an exponential regression to find the equation for the curve of best fit. • Is this equation a good model for the radioactive decay of this element?
Additional From Textbook Try these as well with your TI-83 Graphing Calculators, or Excel, or other spreadsheet software: Page 69 #5, 7 Homework is the additional sheet, left side with “Linear Regression” as the title. We will do some by hand, but you may also practice them with a technological aid (Excel, TI-83, Numbers, etc.). You do need to get the regression line ON the graph!!!