Download
1 / 32
320 likes | 342 Vues
Explore effective population size, historical importance of genetic drift, and F-statistics in genetic variation analysis. Learn to calculate FST coefficients and partition genetic variation using Nei's Gene Diversity and AMOVA methods. Gain insights into the application of FST for studying population structures.

E N D
Lecture 13: Population Structure October 8, 2012
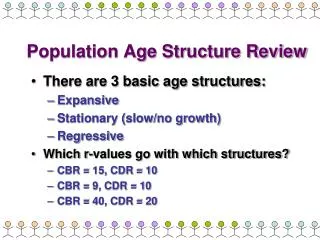
Last Time • Effective population size calculations • Historical importance of drift: shifting balance or noise? • Population structure
Today • Course feedback • The F-Statistics • Sample calculations of FST • Defining populations on genetic criteria
Midterm Course Evaluations • Based on five responses: It’s not too late to have an impact! • Lectures are generally OK • Labs are valuable, but better organization and more feedback are needed • Difficulty level is OK • Book is awful
T S F-Coefficients • Quantification of the structure of genetic variation in populations: population structure • Partition variation to the Total Population (T), Subpopulations (S), and Individuals (I)
F-Coefficients Combine different sources of reduction in expected heterozygosity into one equation: Deviation due to inbreeding within populations Overall deviation from H-W expectations Deviation due to subpopulation differentiation
F-Coefficients and IBD • View F-statistics as probability of Identity by Descent for different samples Probability of IBD within an individual Overall probability of IBD Probability of IBD for 2 individuals in a subpopulation
F-Statistics Can Measure Departures from Expected Heterozygosity Due to Wahlund Effect where HT is the average expected heterozygosity in the total population HS is the average expected heterozygosity in subpopulations HI is observed heterozygosity within a subpopulation
B2B2 = white; B1B1 and B1B2 = dark pink Subpopulation 1: F(white) = 10/20 = 0.5 F(B2)1 = q1= 0.5 = 0.707 p1=1-0.707 = 0.293 Subpopulation 2: F(white)=2/20=0.1 F(B2)2 = q2 = 0.1 = 0.32 p2 = 1-0.32 = 0.68 Calculating FST Recessive allele for flower color White: 10, Dark: 10 White: 2, Dark: 18
Calculate Average HE of Subpopulations (HS) For 2 subpopulations: HS = Σ2piqi/2 = (2(0.707)(0.293) + 2(0.32)(0.68))/2 HS= 0.425 Calculate Average HE for Merged Subpopulations (HT): F(white) = 12/40 = 0.3 q = 0.3 = 0.55; p=0.45 HT= 2pq = 2(0.55)(0.45) HT= 0.495 Calculating FST White: 10, Dark: 10 White: 2, Dark: 18
Bottom Line: • FST = (HT-HS)/HT = • (0.495 - 0.425)/ 0.495 = 0.14 • 14% of the total variation in flower color alleles is due to variation among populations AND • Expected heterozygosity is increased 14% when subpopulations are merged (Wahlund Effect) White: 10, Dark: 10 White: 2, Dark: 18
Nei's Gene Diversity: GST Nei's generalization of FST to multiple, multiallelic loci Where HS is mean HE of m subpopulations, calculated for n alleles with frequency of pj Where pj is mean allele frequency of allele j over all subpopulation
Unbiased Estimate of FST • Weir and Cockerham's (1984) Theta • Compensates for sampling error, which can cause large biases in FST or GST (e.g., if sample represents different proportions of populations) • Calculated in terms of correlation coefficients Calculated by FSTAT software: http://www2.unil.ch/popgen/softwares/fstat.htm Goudet, J. (1995). "FSTAT (Version 1.2): A computer program to calculate F- statistics." Journal of Heredity 86(6): 485-486. Often simply referred to as FST in the literature Weir, B.S. and C.C. Cockerham. 1984. Estimating F-statistics for the analysis of population structure. Evolution 38:1358-1370.
Schemske and Bierzychudek 2007 Evolution Linanthus parryae population structure • Annual plant in Mojave desert is classic example of migration vs drift • Allele for blue flower color is recessive • Use F-statistics to partition variation among regions, subpopulations, and individuals • FST can be calculated for any hierarchy: • FRT: Variation due to differentiation of regions • FSR: Variation due to differentiation among subpopulations within regions
FST as Variance Partitioning • Think of FST as proportion of genetic variation partitioned among populations where V(q) is variance of q across subpopulations • Denominator is maximum amount of variance that could occur among subpopulations
Analysis of Molecular Variance (AMOVA) • Analogous to Analysis of Variance (ANOVA) • Use pairwise genetic distances as ‘response’ • Test significance using permutations • Partition genetic diversity into different hierarchical levels, including regions, subpopulations, individuals • Many types of marker data can be used • Method of choice for dominant markers, sequence, and SNP
Correlation of random pairs of haplotypes drawn from a region relative to pairs drawn from the whole population (FRT) Correlation of random pairs of haplotypes drawn from an individual subpopulation relative to pairs drawn from the whole population (FST) Correlation of random pairs of haplotypes drawn from an individual subpopulation relative to pairs drawn from a region (FSR) Phi Statistics from AMOVA http://www.bioss.ac.uk/smart/unix/mamova/slides/frames.htm
What if you don’t know how your samples are organized into populations (i.e., you don’t know how many source populations you have)?What if reference samples aren’t from a single population? What if they are offspring from parents coming from different source populations (admixture)?
Londo and Schaal 2007 Mol Ecol 16:4523 Defining populations on genetic criteria • Assume subpopulations are at Hardy-Weinberg Equilibrium and linkage equilibrium • Probabilistically ‘assign’ individuals to populations to minimize departures from equilibrium • Can allow for admixture (individuals with different proportions of each population) and geographic information • Bayesian approach using Monte-Carlo Markov Chain method to explore parameter space • Implemented in STRUCTURE program: • http://pritch.bsd.uchicago.edu/structure.html
Example: Taita Thrush data* • Three main sampling locations in Kenya • Low migration rates (radio-tagging study) • 155 individuals, genotyped at 7 microsatellite loci Slide courtesy of Jonathan Pritchard
Estimating K • Structure is run separately at different values of K. The program computes a statistic that measures the fit of each value of K (sort of a penalized likelihood); this can be used to help select K. Posterior probability of K Assumed value of K ~0 ~0 0.993 0.007 0.00005 12345 • Taita thrush data
Another method for inference of K • The K method of Evanno et al. (2005, Mol. Ecol. 14: 2611-2620): Eckert, Population Structure, 5-Aug-2008 46
Inferred population structure Africans Europeans MidEast Cent/S Asia Asia Oceania America Each individual is a thin vertical line that is partitioned into K colored segments according to its membership coefficients in K clusters. Rosenberg et al. 2002 Science 298: 2381-2385
Inferred population structure – regions Rosenberg et al. 2002 Science 298: 2381-2385