Population Age Structure Review
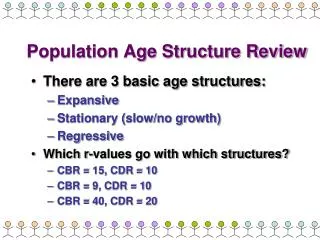
Population Age Structure Review. There are 3 basic age structures: Expansive Stationary (slow/no growth) Regressive Which r-values go with which structures? CBR = 15, CDR = 10 CBR = 9, CDR = 10 CBR = 40, CDR = 20. Population Pyramids—which is which?.

Population Age Structure Review
E N D
Presentation Transcript
Population Age Structure Review • There are 3 basic age structures: • Expansive • Stationary (slow/no growth) • Regressive • Which r-values go with which structures? • CBR = 15, CDR = 10 • CBR = 9, CDR = 10 • CBR = 40, CDR = 20
Population Pyramids—which is which? Images adapted from: http://www.health.state.pa.us/hpa/stats/techassist/pyramids.htm
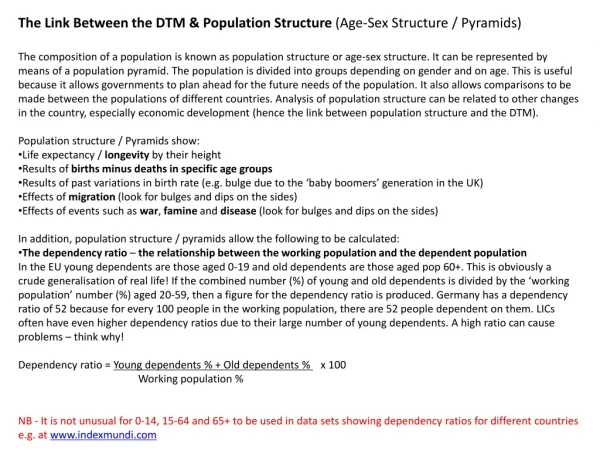
Demographic Transition • Basically, as countries become more developed/more industrialized, two things happen: • First • The death rates decline • And then • Their birth rates decline
There are 4 stages to demographic transition • Pre-industrial • Transitional • Industrial • Post-industrial
Stage 1: Pre-industrial • Pre-industrial- high birth, high death—balanced • This is what existed for the bulk of human history with growth rates of less than 0.05% • High death rates caused by: • Lack of clean drinking water • Lack of efficient sewage disposal • Poor food hygiene
Stage 2: Transitional • Transitional- Death rates drop, but birth rates remain high • The decline in the death rate is due initially to two factors: • improvements in food supply • significant improvements in public health that reduced mortality, particularly in childhood. Examples?
What are differences in the transitional stage between Mexico and Sweden? Figure from: http://www.uwmc.uwc.edu/geography/Demotrans/demtran.htm
Figure from: http://www.uwmc.uwc.edu/geography/Demotrans/demtran.htm
Stage 3: Industrial • Industrial- Birth rates drop, due to a variety of causes including: • Increasing urbanization • Increasing female literacy and employment • Improvements in contraceptive technology
What can you observe on this graph?? Figure from: http://www.uwmc.uwc.edu/geography/Demotrans/demtran.htm
What happened to Mexico’s population between 1980 and 1998?? Figure from: http://www.uwmc.uwc.edu/geography/Demotrans/demtran.htm (from: http://www.census.gov/ipc/www/idbpyr.html)
Stage 4: Postindustrial • Postindustrial- birth rates drop to equal death, then may decline BELOW death rates • If birth rates go below death rates the population starts… • DECREASING
Figure from: http://www.uwmc.uwc.edu/geography/Demotrans/demtran.htm
Differences in demographic transition between more and less developed nations • Less developed nations have a: • Later (in history) transition • Faster decline in death rates • Longer time lag between death rate decline and birth rate decline---economic changes are slower to come than they were in more developed nations • Higher maximum growth rates
Population Growth through Natural Increase, 1775–2000 Figure from: http://www.prb.org/Content/NavigationMenu/PRB/Educators/Human_Population/Future_Growth/Natural_Increase_and_Future_Growth.htm