Download
1 / 13
130 likes | 153 Vues
Explore the impact of R&D projects on society and enhance accountability with evaluation systems. Learn about follow-up monitoring tools, case studies, and feedback for management to refine project outcomes and support policy planning.

E N D
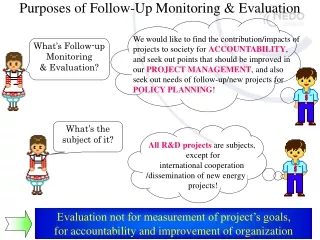
Purposes of Follow-Up Monitoring & Evaluation We would like to find the contribution/impacts of projects to society for ACCOUNTABILITY, and seek out points that should be improved in our PROJECT MANAGEMENT, and also seek out needs of follow-up/new projects for POLICY PLANNING! What’s Follow-up Monitoring & Evaluation? What’s the subject of it? All R&D projects are subjects, except for international cooperation /dissemination of new energy projects! Evaluation not for measurement of project’s goals, for accountability and improvement of organization
Follow-Up Monitoring & Evaluation Systems for National R&D at NEDOPart II ~ Feedback for Management~ American Evaluation Association Conference October 28, 2005 Hiroshi Sano, sanohrs@nedo.go.jp Shuji Yumitori, yumitorisji@nedo.go.jp Kazuaki Kohmoto, Kohmotokza@nedo.go.jp New Energy and Industrial Technology Development Organization (NEDO) http://www.nedo.go.jp/english/index.html
Contents ☞Purpose ☞A Need for the New Tool (Follow-up Chart) ☞Case Studies ☞Feedback for Management ☞Conclusions
Objective Derive concrete implications to improve R&D management methods. Follow major events throughout the project and understand key points on management or the reason why certain events happened through interviews.
A Need for New Tool Statistical data didn’t help to derive concrete implications. For example, it would be too bold to conclude from the following graph that we should exclude companies whose objective for participation were improvement of their technical level. Understanding when certain events happened or the magnitude of each event in detail solely by interviews was particularly difficult. Personnel training Other Challenge a new technical target Invitation of other organization Matched a purpose of the organization Improvement of technology Create network Challenge a new technical target Invitation of other organization Matched a purpose of the organization Improvement of technology Create network Objective for participation Personnel training Other Practical application & commercialization (n=78) No post-project activity (n=246) ※ Multiple answers allowed
Follow-up Chart Methodologies ☞ Conduct a interview to a company about major events on the project and influences of management. ☞ Plot the above information in a conceptual chart. ・ The horizontal axis is the time from the beginning to present. ・ The vertical axis is possibilities or expectation for practical use of technology. (The vertical axis is interviewee’s personal opinion because to measure the possibilities was difficult.) ☞ Determinetheformofthechartthroughtheinterview. ☞ Understandthepositive/negativefactorswhichwould affect the possibility of practical use of the R&D results through the interview.
Follow-up Chart (Image) ~Status from the beginning ~ : Turning point Possibilities/expectation for practical use Large Mid. term Evaluation Mid. Follow the events at the turning points and influ- ence/effect of management for practical use. Small Plan- ning End term Evaluation 1st year 2st year 3rd year 4th year 5th year Present Time (-) ◆ It is difficult to find a fixed quantity of possibilities. The vertical axis is based on interviewee’s opinion.
Case Studies Case Study A ⑥Under the leadership of METI, the demand promotion committee was established, which helped spur the industry. ⑦The R&D went smoothly because there was a liaison personnel who was able to integrate the R&D and business unit. ⑤The old technical approach was examined thoroughly for six months. This helped achieve the development of the prominent new approach. . (Relation to ①) ●It became clear that the method did not go well technically. In addition, the law did not allow the use of materials that they were counting on. ☆Factors that raised the possibilities of practical use. Red:by NEDOItalic:by except for NEDO ①Development of bold approach. (Relation to ⑤) ②Large scale demonstration test. ③Influential figure. ④High level targets. ⑤Old approach was examined thoroughly (Relation to ①) ⑥Government spurred industry. ⑦Key person who was integrate the R&D/business unit. Possibilities/expectation for practical use Large ④Project goals were high. A list of targets was created to demonstrate what needed to be accomplished. Although there was hope to collect necessary materials, odds for success seemed low due to legal issues. Mid. ●Demand has reached its critical level. Measures under government leadership are desirable. Small 2nd year 3rd year Final year 1st year Time Plan- ning Present ②The trial productions were tested by real users, which led to the grater possibilities for commercialization. This is due to a large scale demonstration test that earned user's confidence. ①A bold technical approach was developed. (Relation to ⑤) ③There was an influential figure in NEDO. This particular individual persuaded the technical committee and the government to adapt to the new technical approach.
Case Study B Collaboration scheme went well in the basic R&D phase. Collaboration between basic science, electronic board and device group was good. Possibilities/expectation for practical use Attainment of “World’s best” data. Emergence of technical problem for practical use.Technology for stable/mass production, cost reduction, patent problems etc. Large Human network Enhanced business opportunity by human network. Capitalization on human network acquired from the project. Various trial & error testing methods were available. Efficiency and performance increased threefold. Appropriate evaluation based on the results. Budget allocation based on mid-term evaluation. From research phase to practical phase. Well planed collaboration scheme (Producer and Consumer, etc.)Important information such as spec or permission range of quality was obtained. Color Indication Solid relationship with universities. Universities acquired the same equipments as companies which fostered data analysis and evaluation. Mid. Positive factor Negative factor Collaboration scheme is not always beneficial. Well organized collaboration system in the basic R&D phase became an obstacle in the practical R&D phase. Med. Term Evaluation Setting goals emphasized on “The World’s first” and “The World’s best” to attempt to be the World’s #1. Small Modification of company organization to identify business opportunities. Company executives attended conferences to present project results, which helped them to create a stronger network with other attendees. This helped win support for the project within the company. Environment was favorable for a company to enter into a new tech. field. Collaboration with universities and/or user companies was useful. End term evaluation 1st year 2nd year 3rd year 4th year Final year Planning Present Time
Consideration Follow-up chart shows on a simple peace of paper: ☞ Positive/negative effects and the magni- tude of events. ☞ Change of personal opinion concerning possibilities for practical use. ☞ Status of R&D, business and social environment. ◆ (Attention) - Selection of the items or magnitude of the events that were recorded on the chart is influenced by interviewee’s personal opinions. - Personal opinions determine the shape of the chart.
Feedback for Management (Image) Budget Request Goal Setting Member Setting Check List Check List Check List Mid.term Evaluation Check List G u i d e l i n e Concrete Implications ・Does the project earn user’s confidence?(from case study A) ・Do you have backup schemes for situations where a company ente- ring a new business/tech. field joins the project? (from case study B)
Conclusions Follow-up chart is a useful tool for improving management. Follow-up chart is based on personal opinion. (Further consideration will be needed.) OK ☞ Follow major events throughout the project and understand key points on management or the reason why certain events happened by hearing. ☞ Derive concrete implications on project management. OK
Finally I have introduced how to feedback of follow-up evaluation for management. Today, I would like to know about your activity about feedback for management. I would be happy if I could acquire some suggestions about the vertical axis. Thank you for your attention.