Coordinate Systems
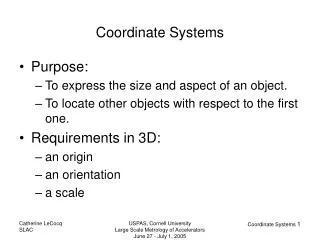
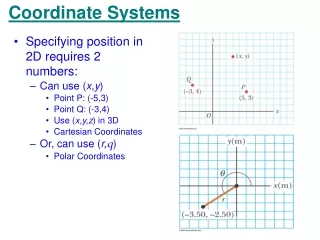
Coordinate Systems. Global Coordinate System – Latitude, Longitude and elevation UTM – eastings and northings, reference points are the equator and the central meridians (60 of them for 60 zones) Extends from 84 ° N to 80 °S

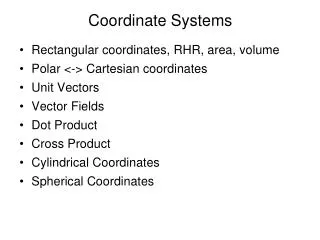
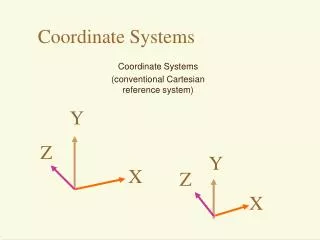
Coordinate Systems
E N D
Presentation Transcript
Coordinate Systems • Global Coordinate System – Latitude, Longitude and elevation • UTM – eastings and northings, reference points are the equator and the central meridians (60 of them for 60 zones) Extends from 84° N to 80 °S • State Plane – State specific, northings and eastings NAD 27 is based on feet, NAD 83 is based on meters. • There are many many more.
Reference Ellipsoids and Datums • Clark 1866 spheroid – NAD 27 (Sometimes Clark 1880?) • GRS 80 spheroid – NAD 83 • WGS 84 spheriod – NAD 83 • Sphere – for world projections • Many many more.
Types of Projections with examples • Planar (Azimuthal) - North Polar Stereographic • Conic – Lambert Conformal Conic, Albers Equal Area, Polyconic • Cylindrical – Mercator and Transverse Mercator
GIS is composed of layers • Layers • land/water • roads • urban areas • pollution levels • Data can be represented by VECTORS, or • Data can be represented by RASTERS
Vector GIS • Every object is given a location • Database consists of points, lines and polygons
Raster GIS • Every location given an object • Grid • Cells or pixels
Creating A Raster • Overlay grid on real world • give each cell a value
Cell Values • Assume only one value per cell in any given layer • How do you decide what value to give the cell? • Value of greatest proportion? • Value of the most important feature? • Some systems allow for percent composition, edge effect
Cell Values • Integer • Real Numbers • Alphabetic • Interpret using legend
Characteristics of a Raster • Resolution • smallest unit discernible • often grid size, but not always • Orientation • angle that grid makes with true north • Value • information stored in cell
Characteristics of a Raster • Zones • areas of continuous values • e.g. county, land parcels, etc. • Class - term used to describe all the zones of same value in a layer
Characteristics of a Raster • Location • each cell has a unique location • often defined by bottom left corner • X, Y coordinate
Storing the Information • Full length encoding • store every single cell’s value individually
Storing the Information • Run Length encoding • compress data
Storing the Information • Quadtree Encoding – compress data
Sources of Raster Data • Scanned Images • Aerial photographs • maps • Satellite images • Many packages work on RECTIFYING these images • photograph’s scale is not constant across image
Vector GIS • Every object is given a location • Database consists of points, lines and polygons
Creating a Vector GIS • Define Points • fundamental property of a vector GIS • no dimensions, but they have a location • can have attributes associated with it • used for utility poles, sampling points, wells etc.
Creating a Vector GIS • Define Arcs (lines) • line that joins points • also called chains and edges • has length and direction • attributes can include what is on right and left side • used to represent road, utility lines, rivers, etc.
Creating a Vector GIS • Two Methods of Defining Polygons • Polygon Storage • Arc Storage • Used to represent lakes, landuse categories, forest stands, etc.
Polygon Storage • Store Polygon as series of points, starting and ending at same point • Each line encoded twice • Difficult to dissolve boundary
Polygon Storage - Use Arcs(more common) • Every arc stored as a sequence of points • Every polygon stored as series of arcs • Boundaries only stored once • Nodes are points where arcs meet or end
Topology • The geometric relationship between objects located in space. • Adjacency • Containment • Connectivity
Raster and Vector Summary • Vectors have advantage of accuracy but not good with continuous fields • Vectors were used first - digitizing • Earliest include ASCII (x,y coordinates but got too large) then binary took over. • Raster not good with lines or points but good with continuous coverage areas. • Raster has the mixed pixel problem.
Raster Advantages: • Simple data structure • Compatible with remotely sensed or scanned data • Simple spatial analysis procedures • Raster Disadvantages: • Requires greater storage space on computer • Depending on pixel size, graphical output may be less pleasing • Projection transformations are more difficult • More difficult to represent topological relationships
Vector Advantages • Requires less disk storage space • Topological relationships are readily maintained • Graphical output more closely resembles hand-drawn maps • Vector Disadvantages • More complex data structure • Not as compatible with remotely sensed data • Software and hardware are often more expensive • Some spatial analysis procedures may be more difficult • Overlaying multiple vector maps is often time consuming
Maps as numbers • Binary 0000 1111 • Eight bits in a row are termed a byte • 256 conbinations or 0 to 255 • ASCII text- American Standard Code for Information Interchange - 256 standard meanings for the values that fall into one byte. (letters, numbers, special characters)
Vector Data Formats • DXF Digital Exchange Format (Autocad) ASCIIw/binary code mantains layers • ArcView Shapefiles 9 (.shp) • HPGL Hewlett-Packard Graphics Language • A device-specific but industry standard language for defining vector graphics in page coordinates (ASCII) - no topology • Adobe PostScript ASCII
Vector Data Formats • DLG Digital Line Graph - USGS (1:100,000 & 1:24,000) ASCII UTM • TIGER U.S. Census Bureau (Topologically Integrated Geographic Encoding and Referencing) • Geocoded block address-matching • Topology correct, but accuracy problems
Raster Data Formats • DRG Digital Raster Graph • TIF Tagged Interchange Format • GIF Graphics Interchange Format • JPEG Joint Photographic Experts Group • GeoTiff – Geographical referenced TIF Files