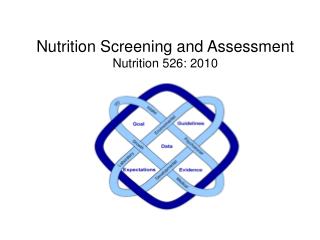
Nutrition Care Process: Assessment
911 likes | 1.5k Vues
Nutrition Care Process: Assessment. Nutrition Assessment. The purpose of nutrition assessment is to collect and interpret relevant patient/client information to identify nutrition-related problems and their causes Is the first step in the Nutrition Care Process

Nutrition Care Process: Assessment
E N D
Presentation Transcript
Nutrition Assessment • The purpose of nutrition assessment is to collect and interpret relevant patient/client information to identify nutrition-related problems and their causes • Is the first step in the Nutrition Care Process • Different from monitoring and evaluation where similar or same data may be used to determine changes in client behavior or nutrition status and the efficacy of nutrition intervention ADA IDNT Reference Manual, 2008, p. 8
Nutrition Assessment Involves Critical Thinking • Determine appropriate data to collect and selecting valid and reliable tools • Distinguish relevant from irrelevant data • Select appropriate norms and standards for comparing the data • Organizing and categorizing the data in a meaningful way that relates to nutrition problems
Nutrition Assessment Is Ongoing • Is the first step in the Nutrition Care Process but not an isolated event • A dynamic process that evolves throughout the NCP as the pt’s status changes or new information becomes available
Nutrition Assessment • In ADA’s draft Standards of Professional Practice (SOPP), nutrition assessment is a function of the registered dietitian • A dietetic technician, registered, contributes by collecting data, providing some interventions, and evaluating and monitoring patient/client response • Assessment parameters and possible nutrition diagnoses are listed in the IDNT manual and pocket guide
Nutrition Assessment Data • Data collected depends on the practice setting • For individuals, data can come directly from pt/client through interview, observations, and measurement; from health care providers or referring agencies, medical record or laboratory tests • For populations, data from surveys, administrative data sets, and epidemiological and research studies are used ADA IDNT Reference Manual, 2008, p. 8
Categories of Nutrition Assessment Data • Food/nutrition history • Biochemical data, medical tests and procedures • Anthropometric measurements • Physical examination findings • Client history IDNT Reference Manual, ADA, 2008, p. 9
Food/Nutrition Histories: Food Intake • Composition and adequacy of food and nutrient intake, meal and snack patterns, environmental cues to eating, food and nutrient tolerance, and current diets and/or food modifications ADA IDNT Reference Manual, 2008, p. 11)
Food/Nutrition Histories: Nutrition and Health Awareness • Knowledge and beliefs about nutrition recommendations, self-monitoring/ management practices, and past nutrition counseling and education ADA IDNT Reference Manual, 2008, p. 11)
Food/Nutrition Histories: Physical Activity and Exercise • Functional status, activity patterns, amount of sedentary time (TV, phone, computer) and exercise intensity, frequency, and duration ADA IDNT Reference Manual, 2008, p. 11
Food/Nutrition Histories: Food Availability • Food planning, purchasing, preparation abilities and limitations, food safety practices, food/nutrition program utilization, and food insecurity ADA IDNT Reference Manual, 2008, p. 11
Biochemical Data, Medical Tests and Procedures • Include laboratory data (e.g. electrolytes, glucose, lipid panel • Gastric emptying time • Colonoscopy, CT scan or EKG results
Anthropometric Measurements • Include height, weight, body mass index, growth chart percentile, growth rate, and rate of weight change
Physical Examination Findings • Include oral health, general physical appearance, muscle and subcutaneous fat wasting, and affect
Client History • Social history: socioeconomic status, social and medical support, cultural and religious beliefs, housing situation, and social isolation/connection • Personal history: factors including age, occupation, role in family, and education level • Medical/health history includes chief nutrition complaint, present/past illness, surgical history, chronic disease or complication risk, family medical history, mental/emotional health and cognitive abilities • Medication/supplement history: prescription and over-the-counter drugs, herbal and dietary supplements, and illegal drugs IDNT Reference Manual, ADA, 2008, p. 11
Methods of Obtaining Intake Data • Direct observation and nutrient analysis: can be used only in controlled settings; doesn’t represent usual intake; calorie counts fall into this category • Food record or diary: prospective tool; asks client to record or weigh food intake for a specific time period • Food frequency questionnaire: retrospective; asks client to complete a survey about food intake over a specific time period • 24-hour recall: retrospective tool; asks client about food intake during the previous 24 hours
Food Diary What’s wrong with this picture?
Anthropometry • Involves obtaining physical measurements of an individual and relating them to standards that reflect the growth and development of the individual • Can be used in nutrition assessment and evaluation and monitoring
Height Measurement • Standing: taken without shoes, feet flat, heels together, legs straight • Arm span: with arms at right angles, distance from tip of the middle finger on the right hand to tip of middle finger on the left; does not change with age • Knee height: can be used to measure stature in those unable to stand; there are equations to convert knee height to stature
Commonly Used Weight Standards • NHANES (%ile or IBW or DBW) • Hamwi (% IBW or DBW) • BMI • % ABW/UBW (weight loss)
Hamwi • Population: small group of people with diabetes; desirable weight related to best blood glucose control • Advantage: Portable and easy to use • Disadvantage: no evidence this is predictive of morbidity/mortality in general or in hospitalized population Hamwi GJ. Changing dietary concepts. In: Donowski TS, ed. Diabetes Mellitus: Diagnosis and Treatment. New York, NY: American Diabetes Association, 1964;73-78.
Metropolitan Height/Weight Tables • Population: 4.2 million mostly Caucasian policy holders; upper socio-economic class. • Advantages: desirable wt associated with lowest morbidity/mortality in this population • Disadvantages: may not apply to different socio-economic classes; requires frame size measurement and reference to a table; data gathering methods poorly controlled; data collected 1954-1972
NHANES DATA • Population: U.S. Population over time; generally percentiles <5 and >95 are considered to be at risk. 50th percentile is median • Advantages: more rigorous data gathering methodology; can be normed to age, sex, race, socio-economic class etc. • Disadvantages: Americans are growing larger; median is not necessarily a healthy weight
NIH BMI Classification • Population: NHANES data has been collected in general population; many RCT use BMI to describe height-weight relationships • Advantage: Strong evidence from RCT and epidemiological studies demonstrating relationship between BMI classification and risk for morbidity and mortality • Disadvantage: Paucity of evidence showing BMI predicts risk in an acute care population
Calculating BMI (Quetelet Index) • BMI = Weight (kg) divided by (height [m]2) OR • BMI = (Weight in Pounds x 703 (Ht/in) x (Ht/in)
“Ideal” Body Weight vs “Usual” Body Weight • Ideal weight for height (IBW) from standards like NHANES and Metropolitan ht/wt tables (and Hamwi) is no longer used—Hammond in K&M, p. 400 • However, IBW IS often used, whether evidence-based or not • Usual body weight is more useful in those who are ill
Weight Status as a Predictor of Morbidity and Mortality • In young to middle aged adults, morbidity/ mortality is highest in the highest quintile of BMI • In the elderly, morbidity/mortality is highest in the lowest quintile of BMI • In most populations, there is a U-shaped relationship between mortality and BMI
Weight Status as a Predictor of Morbidity and Mortality • McClave et al found that “marasmic PCM” defined as <90% “IBW” was not predictive of poor outcome in acute care pts receiving TPN (JPEN16:337. 1002) • Weight loss and unintentional weight loss is strongly predictive of morbidity/mortality, particularly in the elderly. It is unclear whether this is a nutritional issue
Evaluation of Weight Loss • Significant weight loss: 5% loss in 1 month; 7.5% loss in 3 months; 10% loss in 6 months • Severe weight loss: >5% loss in 1 month; 7.5% loss in 3 months, >10% weight loss in 6 months Blackburn GL et al. Nutritional and metabolic assessment of the hospitalized patient. J Parent Ent Nutr 1:11, 1977
Evaluation of % Usual Body Wt • 85-90% of usual weight: mild malnutrition • 75-84% of usual weight: moderate malnutrition • <74% of usual weight: severe malnutrition Buchman AL: Handbook of nutritional support, Baltimore, 1997, Williams & Wilkins, cited in Hammond in Krause, p. 434
Weight Issues in Clinical Settings • Accuracy and reproducibility of weights taken on different scales and by different personnel • Weights of critically ill patients may be unavailable on admission; sometimes heights are not measured • Fluid status • Accuracy of weight history data from patients and family members • Confounding factors (wheelchairs, splints, casts, clothing, amputations) • Question of dosing weight: actual, usual, ideal, adjusted???
Anthropometrics in Pediatrics • Recumbent length measurements used for children younger than 2 or 3 years of age; recorded on birth-to-36 month growth grids • Standing heights of children age 2 or 3 should be recorded on the 2-20 years growth grids • Rate of length or height gain reflects long-term nutritional adequacy • Head circumference: used to evaluate growth in children <3 years of age; usually detects nonnutritional abnormalities
Weight in Pediatrics • A more sensitive measure of nutritional adequacy than height, and reflects recent nutritional intake • Provides crude evaluation of fat and muscle stores
Body Composition: Skinfold Thickness (subcutaneous fat) • Validity depends on measurement technique and repetition over time • Changes take 3 to 4 weeks • Accuracy decreases with increasing obesity • Skinfold sites most reflective of body fatness are over the triceps and the biceps, below the scapula, suprailiac, and upper thigh
Body Composition: Circumference measurements • Waist circumference: smallest area below the ribcage and above the umbilicus; measurements >40 for men and >35 for women are risk factors for disease • Mid arm circumference (MAC) in combination with TSF can determine arm muscle area (lean body mass)
Skinfold Calipers Measure Thickness of Subcutaneous Fat in Millimeters Courtesy Dorice Czajika-Narins, PhD
Other Methods of Body Composition • Underwater weighing • Total body potassium • Neutron activation analysis • BIA: fat free mass and fat mass • CT: subcutaneous and intraabdominal fat • MRI: size of skeleton and internal organs; abdominal fat • DEXA: dual-energy x-ray absorptiometry; bone mineral density and fat and boneless lean tissue