Download
1 / 62
630 likes | 766 Vues
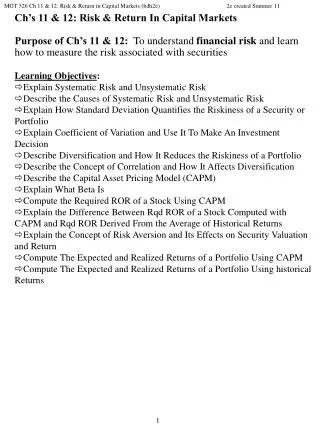
This chapter covers essential concepts related to investment risk and returns. It explains investment returns, both historical and prospective, and how they are calculated in dollar and percentage terms. The chapter discusses the uncertainty of investment returns and the relationship between risk and return, including the concepts of stand-alone and portfolio risk. It introduces the Capital Asset Pricing Model (CAPM) and the Security Market Line (SML), providing insights into risk assessment through standard deviation and coefficient of variation for different investment alternatives.

E N D
CHAPTER 4 Risk and Return: The Basics • Basic return concepts • Basic risk concepts • Stand-alone risk • Portfolio (market) risk • Risk and return: CAPM/SML
HW CHAPTER 4 • ST1, pg 164 B&E • 4-3, 4-7, 4-8, 4-9, 4-13 pg 166-167 B&E
What are investment returns? • Investment returns measure the financial results of an investment. • Returns may be historical or prospective (anticipated). • Returns can be expressed in: • Dollar terms. • Percentage terms.
What is the return on an investment that costs $1,000 and is soldafter 1 year for $1,100? • Dollar return: $ Received - $ Invested $1,100 - $1,000 = $100. • Percentage return: $ Return/$ Invested $100/$1,000 = 0.10 = 10%.
What is investment risk? • Typically, investment returns are not known with certainty. • Investment risk pertains to the probability of earning a return less than that expected. • The greater the chance of a return far below the expected return, the greater the risk.
Selected Realized Returns, 1926 – 2001 Average Standard ReturnDeviation Small-company stocks 17.3% 33.2% Large-company stocks 12.7 20.2 L-T corporate bonds 6.1 8.6 L-T government bonds 5.7 9.4 U.S. Treasury bills 3.9 3.2 Source: Based on Stocks, Bonds, Bills, and Inflation: (Valuation Edition) 2002 Yearbook (Chicago: Ibbotson Associates, 2002), 28.
Probability distribution Stock X Stock Y Rate of return (%) -20 0 15 50 • Which stock is riskier? Why?
What is unique about the T-bill return? • The T-bill will return 8% regardless of the state of the economy. • Is the T-bill riskless? Explain. (nominal)
Do the returns of Alta Inds. and Repo Men move with or counter to the economy? • Alta Inds. moves with the economy, so it is positively correlated with the economy. This is the typical situation. • Repo Men moves counter to the economy. Such negative correlation is unusual.
Calculate the expected rate of return on each alternative. ^ r = expected rate of return. ^ rAlta = 0.10(-22%) + 0.20(-2%) + 0.40(20%) + 0.20(35%) + 0.10(50%) = 17.4%.
^ • Alta has the highest rate of return. • Does that make it best?
What is the standard deviationof returns for each alternative?
Standard Deviation: Another View Why doesn’t this formula have “Probability” in it? All states assumed equally likely. What does the “-1” in the denominator tell us? This is the calculation assuming a sample.
T-bills = 0.0%. Repo = 13.4%. Am Foam = 18.8%. Market = 15.3%. Alta = 20.0%. Alta Inds: = ((-22 - 17.4)20.10 + (-2 - 17.4)20.20 + (20 - 17.4)20.40 + (35 - 17.4)20.20 + (50 - 17.4)20.10)1/2 = 20.0%.
Prob. T-bill Am. F. Alta 0 8 13.8 17.4 Rate of Return (%)
Standard deviation measures the stand-alone risk of an investment. • The larger the standard deviation, the higher the probability that returns will be far below the expected return. • Coefficient of variation is an alternative measure of stand-alone risk.
Comments on standard deviation as a measure of risk • Standard deviation (σi) measures total, or stand-alone, risk. • The larger σi is, the lower the probability that actual returns will be closer to expected returns. • Larger σi is associated with a wider probability distribution of returns. • Difficult to compare standard deviations, because expected return has not been accounted for -comparing two risky propositions, without any idea of the payoff.
Standardized Risk Coefficient of Variation is a measure of relative variability. Shows risk per unit of return. (pain/gain ratio) Should you take the investment with the lowest coefficient of variation (small CV is generally better)?
Coefficient of Variation:CV = Standard deviation/expected return CVT-BILLS = 0.0%/8.0% = 0.0. CVAlta Inds = 20.0%/17.4% = 1.1. CVRepo Men = 13.4%/1.7% = 7.9. CVAm. Foam = 18.8%/13.8% = 1.4. CVM = 15.3%/15.0% = 1.0. ***sigma(Portfolio) = [w1 sigma1 + w2 sigma2 ] , ie weighted average of individual StDevs. If and only If -> ρ12 =1 CV has sigma in the numerator, hence for the reason above, taking a wt. avg. of CV will involve taking a wt. avg . of sigma (or variance) - which is not allowed.
Portfolio Risk and Return Assume a two-stock portfolio with $50,000 in Alta Inds. and $50,000 in Repo Men. ^ Calculate rp and p.
Portfolio Return, rp ^ ^ rp is a weighted average: n ^ ^ rp = wiri i = 1 ^ rp = 0.5(17.4%) + 0.5(1.7%) = 9.6%. ^ ^ ^ rp is between rAlta and rRepo.
Alternative Method Estimated Return ^ rp = (3.0%)0.10 + (6.4%)0.20 + (10.0%)0.40 + (12.5%)0.20 + (15.0%)0.10 = 9.6%. (More...)
p = ((3.0 - 9.6)20.10 + (6.4 - 9.6)20.20 + (10.0 - 9.6)20.40 + (12.5 - 9.6)20.20 + (15.0 - 9.6)20.10)1/2 = 3.3%. • p is much lower than: • either stock (20% and 13.4%). • average of Alta and Repo (16.7%). • The portfolio provides average return but much lower risk. The key here is negative (or less than perfect) correlation. • Var(P) = w1^2 Var1+w2 ^2 Var2+2w1w2*Cov(1,2) • And Cov(1,2) = corr(1,2)*(Var1Var2)^1/2 • If corr(1,2)= 1 then Var(P) = [w11+ w22 ]^2
StDev(P) = [w11+ w22 ] , ie weighted average of individual StDevs. IFF -> ρ12 =1 • σ = w1 σ1 + w2 σ2 , IFF -> ρ12 = σ12/σ1σ2 = 1 • If the correlation coefficient is -1 then portfolio standard deviation is equal σ = w1 σ1 - w2 σ2 and it is possible to achieve the zero portfolio standard deviation by varying the proportion of assets weights w1 and ;w2 in the portfolio. Practically impossible since very few assets are perfectly negatively correlated.
Correlation Coefficient Correlation coefficients () range from … -1 to +1 = -1 implies perfectlynegative correlation = +1 implies perfectlypositive correlation = 0 implies variables are not related Do most stocks have positive, negative, or zero correlations with each other? Positive, but not perfectly so What is correlation of any security with riskless asset (T-bill – is it riskless?)? Zero
Two-Stock Portfolios • Two stocks can be combined to form a riskless portfolio if r = -1.0. • Risk is not reduced at all if the two stocks have r = +1.0. • In general, stocks have r 0.65, so risk is lowered but not eliminated. • Investors typically hold many stocks. • What happens when r = 0?
General comments about risk • Most stocks are positively correlated with the market (ρk,m 0.65). • σ 35% for an average stock. (what is range in 2 of 3 years? E® = 12% from market) • Combining stocks in a portfolio generally lowers risk.
What would happen to therisk of an average 1-stockportfolio as more randomlyselected stocks were added? • p would decrease because the added stocks would not be perfectly correlated, but rp would remain relatively constant. ^
Prob. Large 2 1 0 15 Return 135% ; Large20%.
p (%) Company Specific (Diversifiable) Risk 35 Stand-Alone Risk, p 20 0 Market Risk 10 20 30 40 2,000+ # Stocks in Portfolio
Stand-alone Market Diversifiable = + . risk risk risk Market risk is that part of a security’s stand-alone risk that cannot be eliminated by diversification. Firm-specific, or diversifiable, risk is that part of a security’s stand-alone risk that can be eliminated by diversification.
Two Components of Risk • Company-specific (Diversifiable) risk Unique to specific firms. Results from random or uncontrollable events. What are some examples? Natural disasters, accidents, strikes, lawsuits, death of CEO, etc. • Market (systematic) risk Relates to forces affecting all investments. What are some examples? Inflation, recession, war, yield inversion etc.
Conclusions • As more stocks are added, each new stock has a smaller risk-reducing impact on the portfolio. • p falls very slowly after about 40 stocks are included. The lower limit for p is about 20% = M . • By forming well-diversified portfolios, investors can eliminate about half the riskiness of owning a single stock.
Can an investor holding one stock earn a return commensurate with its risk? • No • Stand-alone risk is not important to a well-diversified investor – because it vaporizes • Rational, risk-averse investors are concerned with σp, which is based upon market risk. • There can be only one price (the market return) for a given security. • No compensation should be earned for holding unnecessary, diversifiable risk.
How is market risk measured for individual securities? • Market risk, which is relevant for stocks held in well-diversified portfolios, is defined as the contribution of a security to the overall riskiness of the portfolio. • It is measured by a stock’s beta coefficient. For stock i, its beta is: bi = cov[i,m]/var[m] = si sm riM / sm^2 = (riMsi) / sM
Betas….? • In addition to measuring a stock’s contribution of risk to a portfolio, beta also measures the stock’s volatility relative to the market. • Shows how the price of a security responds to changes in the overall stock market (not just its variance) • Stock’s Beta is the only relevant measure of risk from a portfolio standpoint: in a well diversified portfolio there is no USR so beta gives the stock’s response to a change in the market (syst. risk)
Using a Regression to Estimate Beta • Run a regression with returns on the stock in question plotted on the Y axis and returns on the market portfolio plotted on the X axis. • The slope of the regression line, which measures relative volatility, is defined as the stock’s beta coefficient, or b.
_ ki . 20 15 10 5 . Year kM ki 1 15% 18% 2 -5 -10 3 12 16 _ -5 0 5 10 15 20 kM Regression line: ki = -2.59 + 1.44 kM . -5 -10 ^ ^ Calculation of Beta
Use the historical stock returns to calculate the beta for PQU.
Calculating Beta for PQU r pqu 40% Show in Excel, and how to get return series on stocks, market 20% r 0% M -40% -20% 0% 20% 40% -20% r = 0.83r + 0.03 PQU M -40% 2 R = 0.36
What is beta for PQU? • The regression line, and hence beta, can be found using a calculator with a regression function or a spreadsheet program. In this example, b = 0.83.
Calculating Beta in Practice • Many analysts use the S&P 500 to find the market return. • Analysts typically use four or five years’ of monthly returns to establish the regression line. • Some analysts use 52 weeks of weekly returns.
How is beta interpreted? • If b = 1.0, stock has average risk. • If b > 1.0, stock is riskier than average. • If b < 1.0, stock is less risky than average. • Most stocks have betas in the range of 0.5 to 1.5. • Can a stock have a negative beta? • Beta of .5 If … Market goes up 1%, … stock only goes up .5%. But if market goes down 1%, stock drops just .5%. • Beta of 0 No correlation with market
Finding Beta Estimates on the Web • http://finance.yahoo.com/q/ks?s=C • http://www.investor.reuters.com/StockEntry.aspx • http://new.quote.com/stocks/company.action?sym=C [change the ticker in the URL Address bar, directly] • http://finance.google.com/finance?q=C • ** Changes in estimation window length, return frequency, choice of market and statistical adjustments will result in varying betas from different sources. It may be best to calculate your own – you can fix the variables and parameters.
Expected Return versus Market Risk • Which of the alternatives is best?
Use the SML to calculate eachalternative’s required return. • The Security Market Line (SML) is part of the Capital Asset Pricing Model (CAPM). • How do we find a security’s required return ki? • SML: ri = rRF + (rM - rRF)bi . • Assume rRF = 8%; rM = rM = 15%. • RPM = (rM - rRF) = 15% - 8% = 7%. • Higher beta means higher market risk and thus higher expected or required [not realized] return.